 ConceptDraw Solution Park
ConceptDraw Solution Park collects graphic extensions, examples and learning materials
HelpDesk
ConceptDraw Software Full Versions Free Download
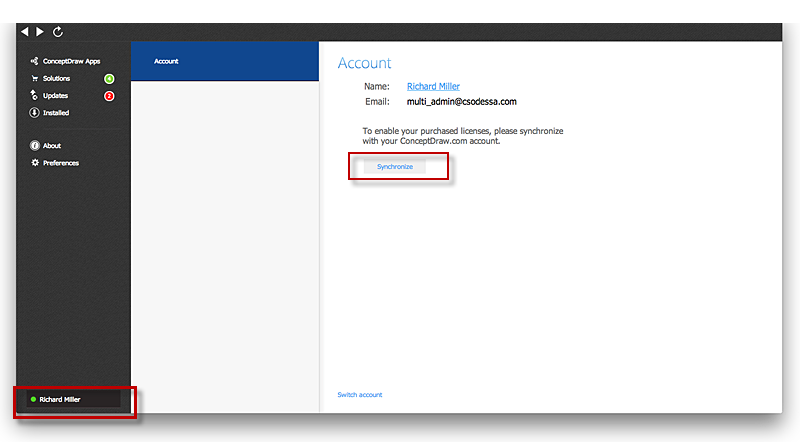
The following article is an instructions on how to download and try ConceptDraw products for free. ConceptDraw software provides registered users a 21 day trial period at no charge. It functions exactly as a fully licensed copy of the product does. Once you have activated your account you are then able to download and install ConceptDraw software as well, as solutions from Solution Park. For 21 days the trial functions exactly like the purchased product. There are no limitations to file size, how many times you can print, or any of the products functionality. After the trial period expires, you will be able to open ConceptDraw documents to view.HelpDesk
How To Create a PERT Chart
Project Evaluation and Review Technique (PERT) is a method of project tasks evaluation and analysis. PERT - is a method of analyzing the tasks required to complete the project. It includes analysis of the time required to complete each task, as well as the determination of the time required to carry out the whole project. PERT was developed to facilitate the planning of huge and complex projects. PERT is used for very large, complex, and non-standard projects. Technology implies the presence of uncertainty, making it possible to develop a schedule of the project without a precise information on details and time required for all of its components. The most popular part of PERT is a method of the critical path, based on the construction of the network schedule (PERT network diagram). ConceptDraw Office delivers you the best way to create PERT chart for your project using compatibility between ConceptDraw PROJECT and ConceptDraw PRO.
 Pie Charts
Pie Charts are extensively used in statistics and business for explaining data and work results, in mass media for comparison (i.e. to visualize the percentage for the parts of one total), and in many other fields. The Pie Charts solution for ConceptDraw PRO v10 offers powerful drawing tools, varied templates, samples, and a library of vector stencils for simple construction and design of Pie Charts, Donut Chart, and Pie Graph Worksheets.
- Free Online Charts
- Flowcharts Online Free
- Flow Chart Online | Online Flow Chart | Process Flowchart | Free ...
- What is Interactive Flowcharts | Flow Chart Online | Process ...
- Online Chart Free
- Free Online Graph Maker
- Free Online Organizational Chart
- Free Online Chart Creator
- Chart Free Online
- Flow Chart Online | Entity Relationship Diagram Software for Design ...
- Free Online Workflow Software
- Flow Chart Online | State Diagram Example - Online Store | Process ...
- Make A Chart Online Free
- Free Online Chart Maker
- Flow Chart Online | Online Flow Chart | What is Interactive ...
- How To Create a PERT Chart | Flow Chart Online | How to Draw the ...
- Process Flowchart | Flow Chart Online | Top 5 Android Flow Chart ...
- Free Online Org Chart
- Online Diagram Tool | Flow Chart Online | Entity Relationship ...
- Flow Chart Online | Online Flow Chart | Entity Relationship Diagram ...
- ERD | Entity Relationship Diagrams, ERD Software for Mac and Win
- Flowchart | Basic Flowchart Symbols and Meaning
- Flowchart | Flowchart Design - Symbols, Shapes, Stencils and Icons
- Flowchart | Flow Chart Symbols
- Electrical | Electrical Drawing - Wiring and Circuits Schematics
- Flowchart | Common Flowchart Symbols
- Flowchart | Common Flowchart Symbols

