HelpDesk
How to Create a Gantt Chart for Your Project
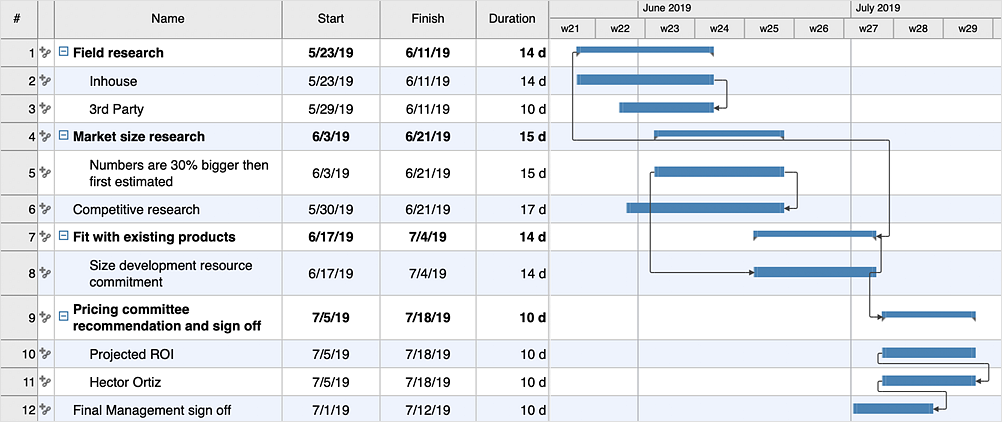
Instruction on how to create Gantt chart using ConceptDraw PROJECT software.Gant Chart is a graphical representation of tasks as segments on a time scale. It helps plan or overlapping.
 Cross-Functional Flowcharts
Cross-functional flowcharts are powerful and useful tool for visualizing and analyzing complex business processes which requires involvement of multiple people, teams or even departments. They let clearly represent a sequence of the process steps, the order of operations, relationships between processes and responsible functional units (such as departments or positions).
HelpDesk
How to Create an IDEF0 Diagram for an Application Development
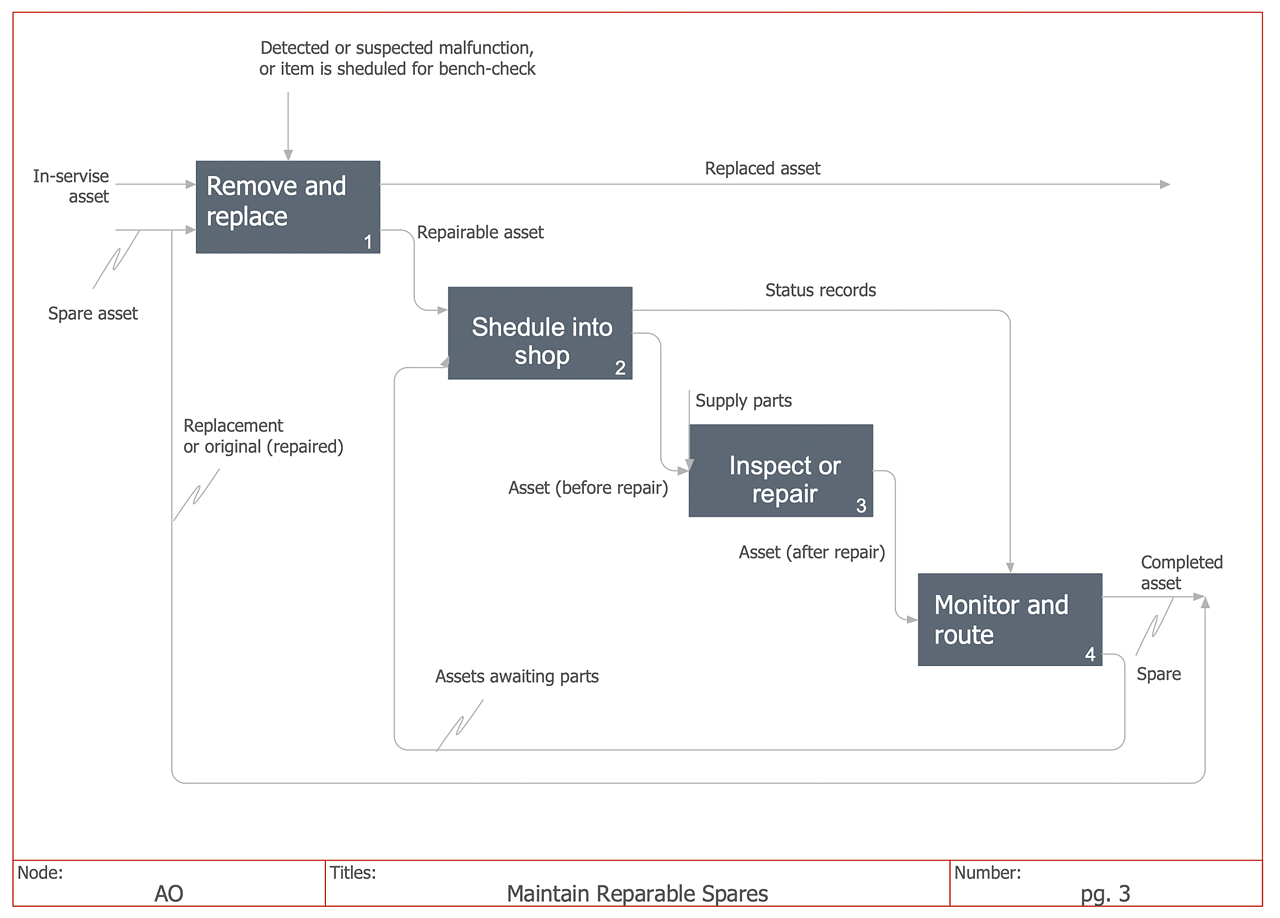
IDEF0 methods are intended to model the functions of a process, creating a graphical model that displays: what controls the function, who makes it, what resources are used and how they are connected with other functions. The IDEF0 tool is used to model the decisions, actions, and activities of a software system during the development process. IDEF0 diagram graphically depicts a model of a desired version of the application. ConceptDraw DIAGRAM allows you to create and communicate the IDEF0 diagrams of any complexity.- Online Chart Creation
- How to Create a Social Media DFD Flowchart | Flow Chart Online ...
- Flow Chart For Online Social Network Creation
- Data Flow Diagrams | Create Flow Chart on Mac | ConceptDraw ...
- Data Flow Diagram For Online Social Network Creation
- Online Diagram Tool | Online Flow Chart | How to Create a Timeline ...
- Flow Chart Online | What is Interactive Flowcharts | How to Create a ...
- Flow Chart Online | Algorithm flowchart - Selection sorting method ...
- Flow Chart Of Online Shopping Website
- Flow Chart Online
- Flow Chart Online | How to Create a Social Media DFD Flowchart ...
- How to Draw an Organization Chart | ConceptDraw PRO ...
- Basic Flowchart Symbols and Meaning | Data Flow Diagrams | Visio ...
- Flow Chart Online | ConceptDraw Solution Park | Online Flow Chart ...
- Flow Chart Online | Online Flow Chart | How to Create a Social ...
- Basic Flowchart Symbols and Meaning | Flowchart design ...
- Contoh Flowchart | Flowchart | Basic Flowchart Symbols and ...
- ConceptDraw PRO - Organizational chart software | How To Create ...
- UML Component Diagram Example - Online Shopping | UML ...
- Flowchart Creation
- ERD | Entity Relationship Diagrams, ERD Software for Mac and Win
- Flowchart | Basic Flowchart Symbols and Meaning
- Flowchart | Flowchart Design - Symbols, Shapes, Stencils and Icons
- Flowchart | Flow Chart Symbols
- Electrical | Electrical Drawing - Wiring and Circuits Schematics
- Flowchart | Common Flowchart Symbols
- Flowchart | Common Flowchart Symbols

