HelpDesk
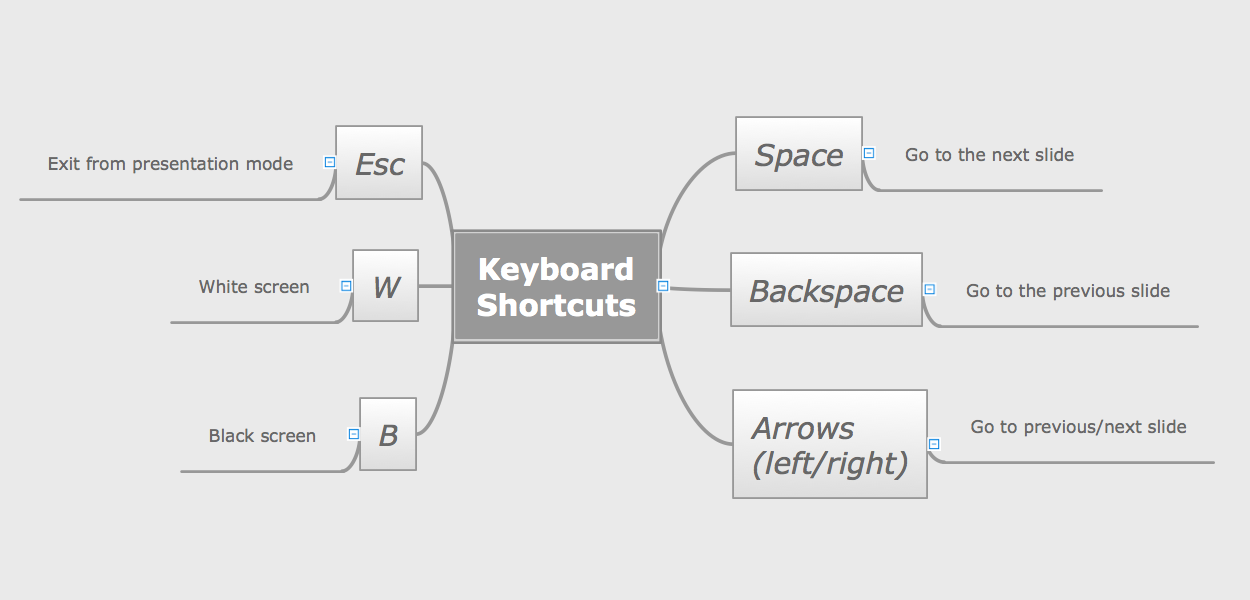
How to Make a Mind Map in PowerPoint
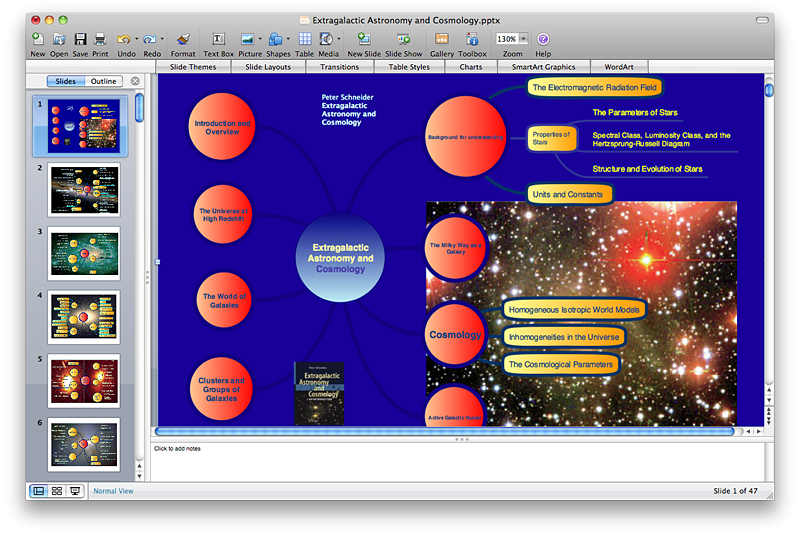
ConceptDraw MINDMAP allows you to create a traditional PowerPoint Presentation from your mind maps.HelpDesk
How to Create a Custom Filter in ConceptDraw PROJECT for Windows
With ConceptDraw Project, you can filter project data so that you only see the information that’s most important to you.
 ConceptDraw Solution Park
ConceptDraw Solution Park collects graphic extensions, examples and learning materials
HelpDesk
How to Create a Cross - Functional Flowchart Using ConceptDraw PRO
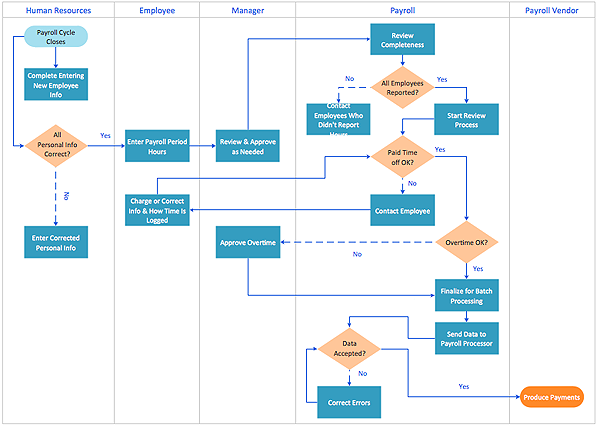
Cross-functional flowcharts are used to visualize cross-functional processes. Cross-functional process is a process that involves multiple divisions, each of which makes its part of the entire company workflow. For example: product development, lead management , client orders processing – and other critical processes. All of them are important both for business and customers, but the workflow and responsibilities distribution within these processes are divided between multiple departments and services. Cross-functional processes cannot be depicted with simple workflow diagrams, because of the specific interactions between company departments. ConceptDraw PRO has released the specialized solution to create cross-functional diagrams. Cross Functional Flowcharts solution includes a special set of templates and libraries to depict the cross-functional processes.
HelpDesk
How to Use a Cross - Functional Flowcharts Solution
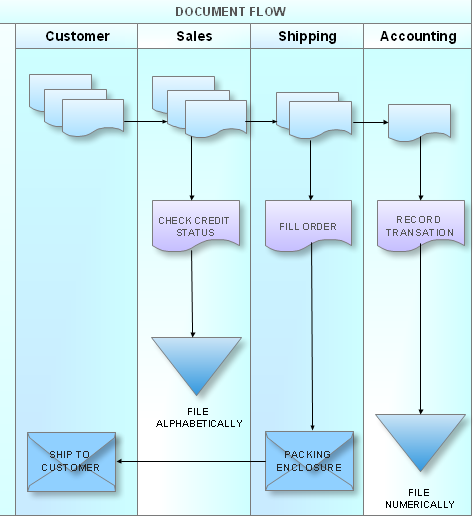
Cross-functional process is a process that involves multiple divisions, each of which makes its part of the entire company workflow. For example: product development, lead management , client orders processing – and other critical processes. Using a Cross-Functional flowchart is a clear way of showing each team member’s responsibilities and how processes get shared or transferred between different teams and departments.The Cross-Functional flowchart is a clear way to visualize the document flow in your organization. The ability to create Cross-functional diagrams is provided by the Cross-Functional Flowcharts solution.
Swim Lane Diagrams
Swim Lane diagrams are the variety of process flow diagrams and are based on the IDEF3 standard. They were developed by Lynn Shostack for usage in projecting. With their help organization diagrams are combined with process flow, as they visually display an object of the production system which is charged with given concrete processes in general flow of processes of the production system.HelpDesk
How to Create a Business Process Diagram
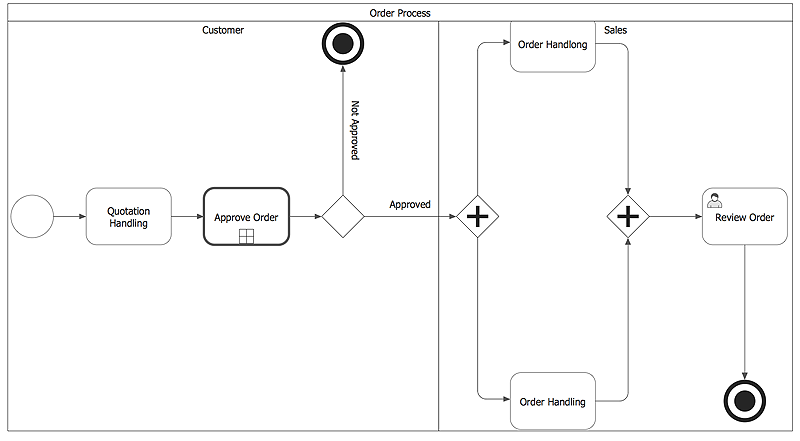
An overview of any business process includes the description of the steps needed to implement any business task. The best approach to business process designing and analyzing is to depict visually the steps of business process in a form of business process diagram. Designing a Business Process diagram includes many different and specific elements that can be managed using ConceptDraw PRO. The ability to create Business Process diagrams according to the BPMN 2.0 is provided by the Business Process Model and Notation solution.HelpDesk
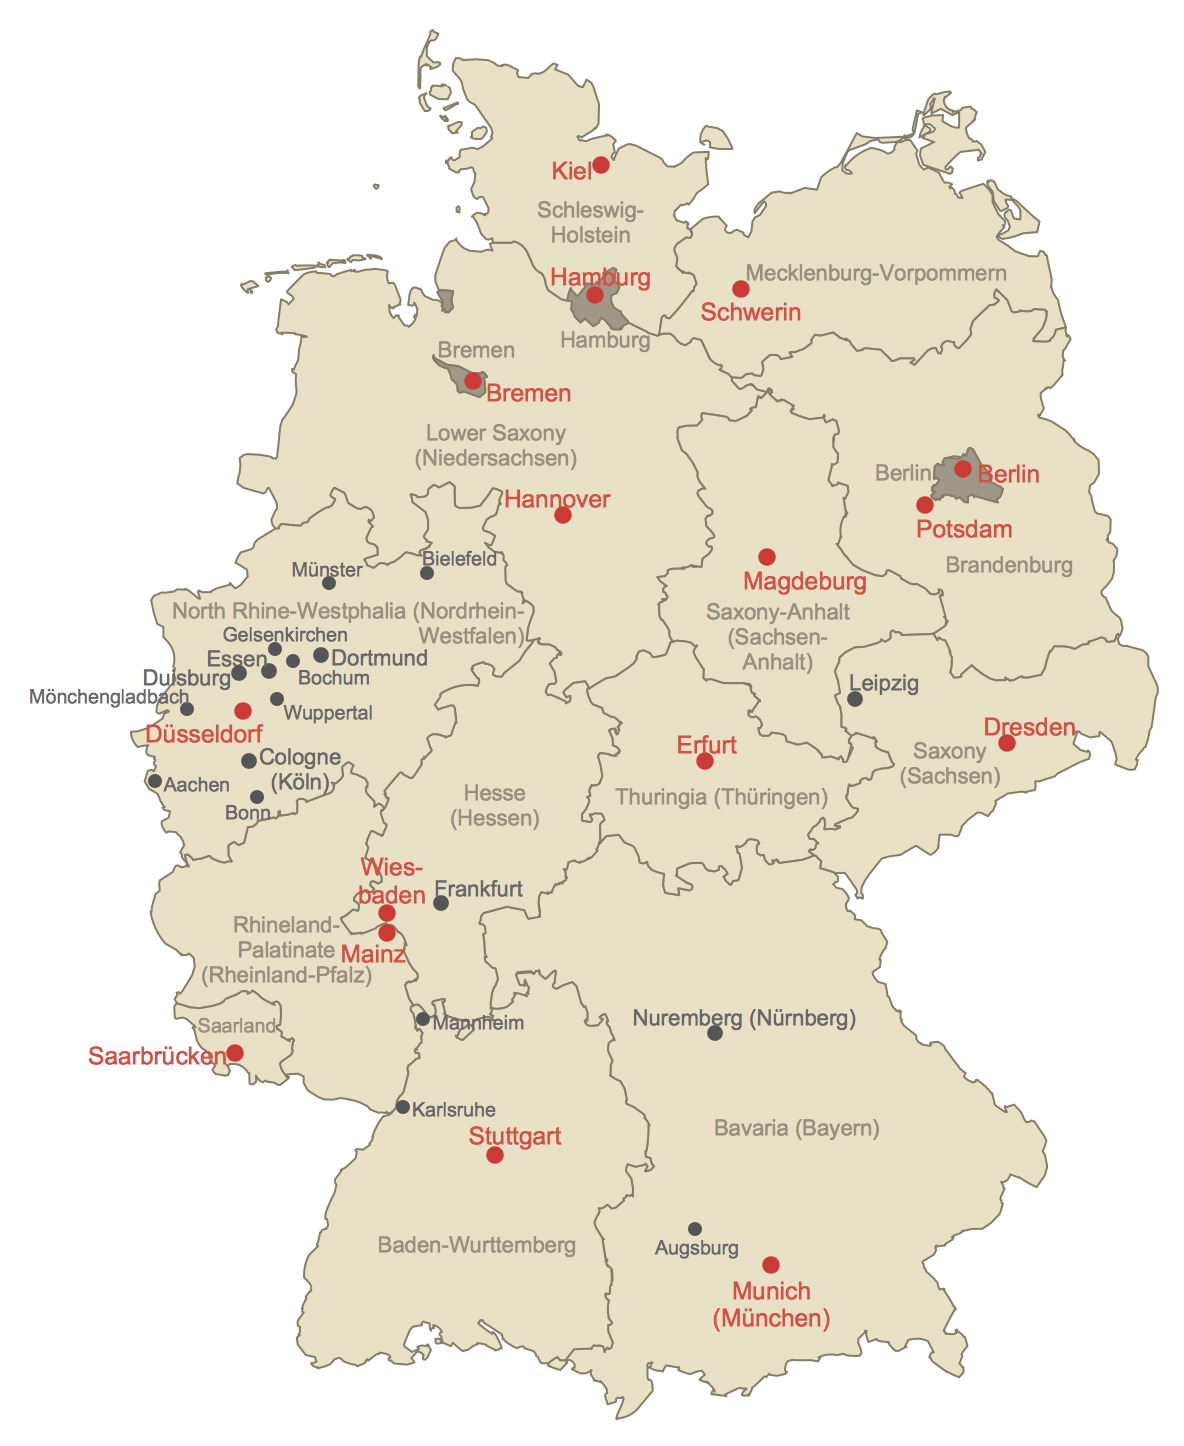
How to Create a Map of Germany Using ConceptDraw PRO
Geographical thematic maps are used to display information on a variety of subjects. It is a common way of representing any form of spatial data in relation to a specific geographical area. The Germany Map Solution for ConceptDraw PRO includes all of the German federal states with county outlined borders and major cities. You can quickly create geographic maps, cartograms, and thematic maps for geographical visualization information for business and travels.HelpDesk
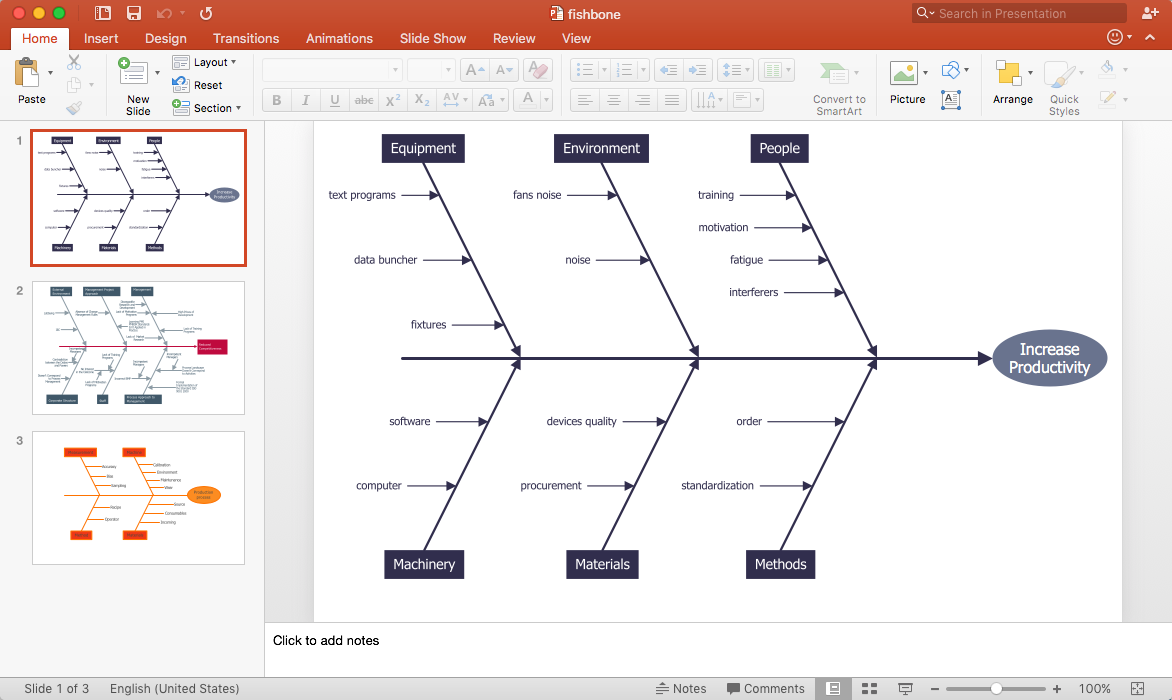
How to Add a Fishbone Diagram to PowerPoint Presentation
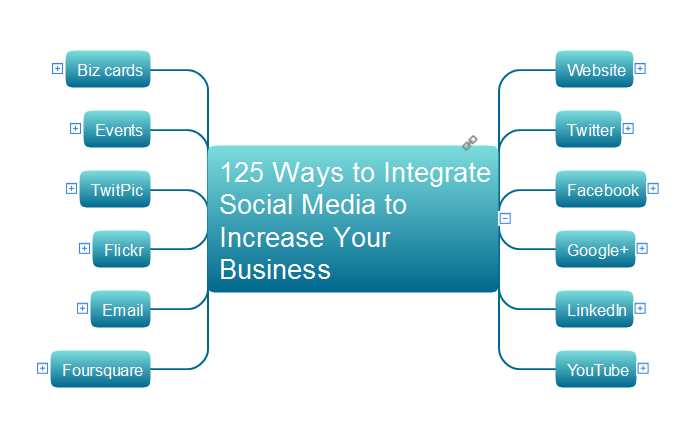
Fishbone (Ishikawa) diagram is often used in business to determine the cause of some problems. The easiest way to draw a Fishbone diagram is using ConceptDraw Fishbone Diagram solution.125 Ways to Integrate Social Media to Increase Your Business
This mind map illustrates modern social media approaches to business marketing that can be presented to others using ConceptDraw MINDMAP and the eLearning for Skype solution.Basic Flowchart Symbols and Meaning
Flowchart Symbols and Meaning - Provides a visual representation of basic flowchart symbols and their proposed use in professional workflow diagram, standard process flow diagram and communicating the structure of a well-developed web site, as well as their correlation in developing on-line instructional projects. See flowchart's symbols by specifics of process flow diagram symbols and workflow diagram symbols.
 PM Planning
The PM Planning solution extends the functional abilities of ConceptDraw MINDMAP and ConceptDraw PROJECT software, allowing to automatically create the spreadsheets reflecting the tasks and project statuses for people who have different project roles. The reporting capabilities of this solution are represented by the possibility to generate a wide range of project reports that allow the project managers, senior management and other project participants to be informed on a project daily progress and monthly objectives: All Inclusive Report, All Visible Columns, Milestones with Notes and Objectives, Projects Goals, Projects Managers, Project Team, and Top Level Tasks. The PM Planning solution from ConceptDraw Solution Park is a strong project management and productivity tool which simplifies the process of reporting and lets one create a document with the desired report, includes the predesigned examples, extends and improves the planning capabilities for all team members, improves the project communication, helps to accurately plan, maintain, and finish projects on time, to track the work of project resources, to perform the analytical work and to make effective decisions.
Cross-Functional Flowchart
Cross-Functional Flowchart - to draw cross functional process maps is by starting with a cross-functional flowchart samples and templates. Easy to draw sample cross functional Process Flow Diagrams. Using a Cross-Functional flowchart is a clear way of showing each team member’s responsibilities and how processes get shared or transferred between different teams and departments.Use cross-functional flowcharts to show the relationship between a business process and the functional units (such as departments) responsible for that process. To create it use the best flowchart maker of ConceptDraw PRO.

 PM Easy
PM Easy solution extends the ConceptDraw PROJECT functionality with an ability to support neutral methodology of project management and to quickly start a project by listing the task relationships and dependencies, that makes the iterative planning much easier. The project management tool and available visual tools, such as mind mapping, increase the effectiveness of tracking and analysis your project tasks. PM Easy solution from ConceptDraw Solution Park is mainly targeted at project managers in small or medium-sized companies, allowing them to make the project plan and execute projects using mind mapping technique, to implement planning using mind mapping, and to track tasks using ConceptDraw PROJECT application.
How To Use Collaboration Software
Collaboration Software helps to transform shared MINDMAP documents to build an effective team collaboration.
- Mac OS X Lion user interface - Template
- Mac OS X Lion buttons and segmented controls - Vector stencils ...
- Ribbon interface - Vector stencils library | Design elements - Tabbed ...
- How To Do A Mind Map In PowerPoint | Looking at ConceptDraw ...
- Microsoft Windows ribbon interface hints | Ribbon interface - Vector ...
- Controls - Vector stencils library | Windows 8 Start screen | DroidDia ...
- Messages - Vector stencils library | How To Create a MS Visio ...
- Mac OS X User Interface | How to Design a Mockup of Apple OS X ...
- How to Design a Mockup of Apple OS X UI | Mac OS GUI Software ...
- How To use House Electrical Plan Software | Network Drawing ...
- Baseball positions - Vector stencils library | General window ...
- Mac OS X User Interface | How to Design a Mockup of Apple OS X ...
- Interactive voice response (IVR) - Vector stencils library | Interactive ...
- Cafe Decor | How To Create Restaurant Floor Plan in Minutes ...
- Mac OS User Interface Design Examples | How to Design a Mockup ...
- Design elements - Video surveillance | Video surveillance scheme ...
- Wireframe GUI - Template | Site Plans | Office Layout Plans ...
- How to Design a Mockup of Apple OS X UI | Mac OS X User ...
- Mac OS X User Interface | How to Design a Mockup of Apple OS X ...
- Design elements - List blocks | Design elements - Management list ...
- ERD | Entity Relationship Diagrams, ERD Software for Mac and Win
- Flowchart | Basic Flowchart Symbols and Meaning
- Flowchart | Flowchart Design - Symbols, Shapes, Stencils and Icons
- Flowchart | Flow Chart Symbols
- Electrical | Electrical Drawing - Wiring and Circuits Schematics
- Flowchart | Common Flowchart Symbols
- Flowchart | Common Flowchart Symbols
