Network wiring cable. Computer and Network Examples
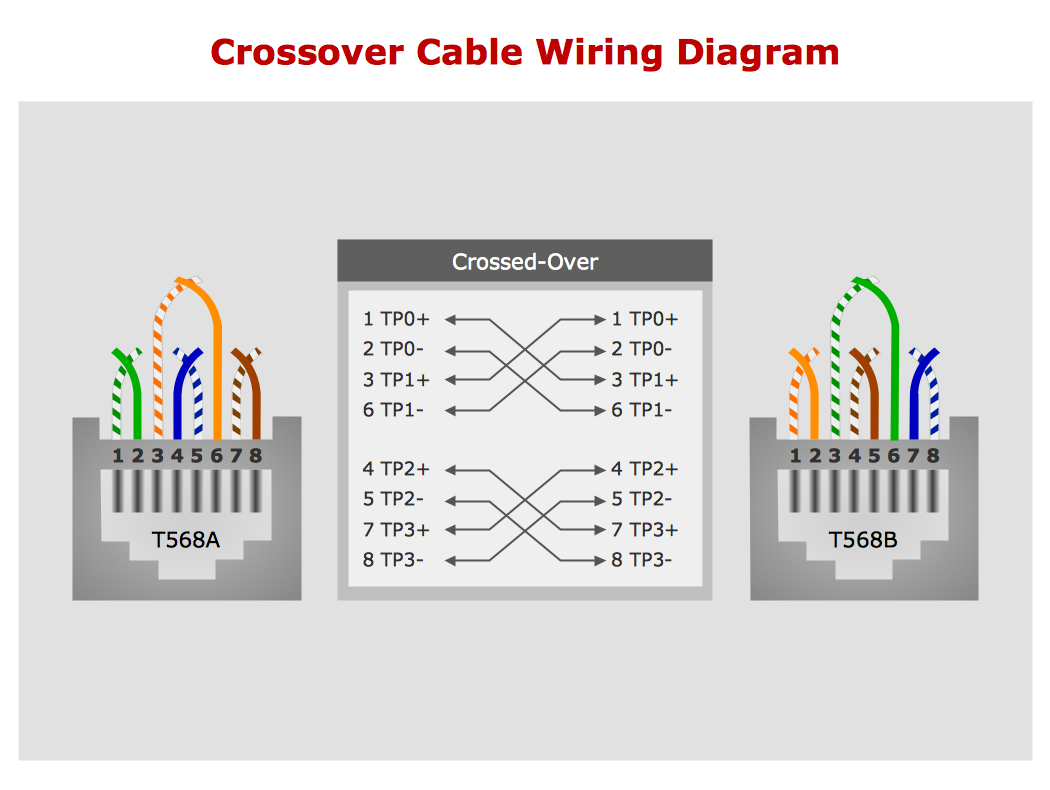
This example was created in ConceptDraw DIAGRAM using the Computer and Networks solution from the Computer and Networks area of ConceptDraw Solution Park.

Data structure diagram with ConceptDraw DIAGRAM

 Logistics Flow Charts
Logistics Flow Charts solution extends ConceptDraw DIAGRAM functionality with opportunities of powerful logistics management software. It provides large collection of predesigned vector logistic symbols, pictograms, objects and clipart to help you design with pleasure Logistics flow chart, Logistics process flow diagram, Inventory flow chart, Warehouse flowchart, Warehouse management flow chart, Inventory control flowchart, or any other Logistics diagram. Use this solution for logistics planning, to reflect logistics activities and processes of an enterprise or firm, to depict the company's supply chains, to demonstrate the ways of enhancing the economic stability on the market, to realize logistics reforms and effective products' promotion.
 Entity-Relationship Diagram (ERD)
An Entity-Relationship Diagram (ERD) is a visual presentation of entities and relationships. That type of diagrams is often used in the semi-structured or unstructured data in databases and information systems. At first glance ERD is similar to a flowch
SDL Diagram
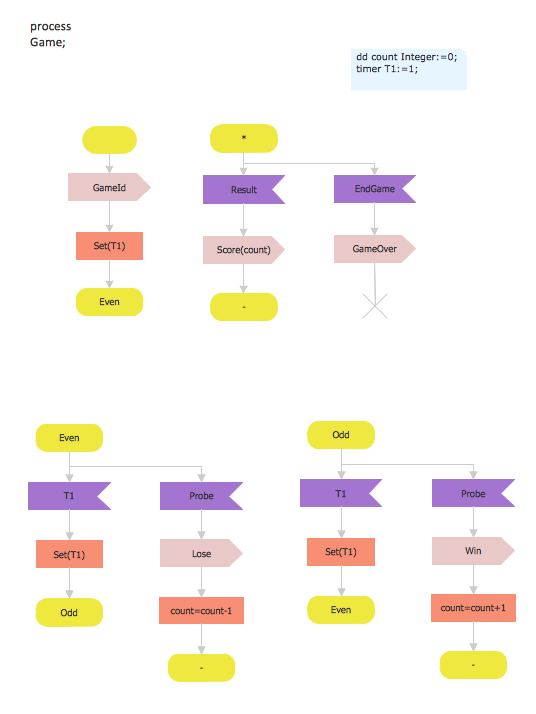
This sample shows the SDL Diagram of the process game.
Hotel Network Topology Diagram. Hotel Guesthouse WiFi Network
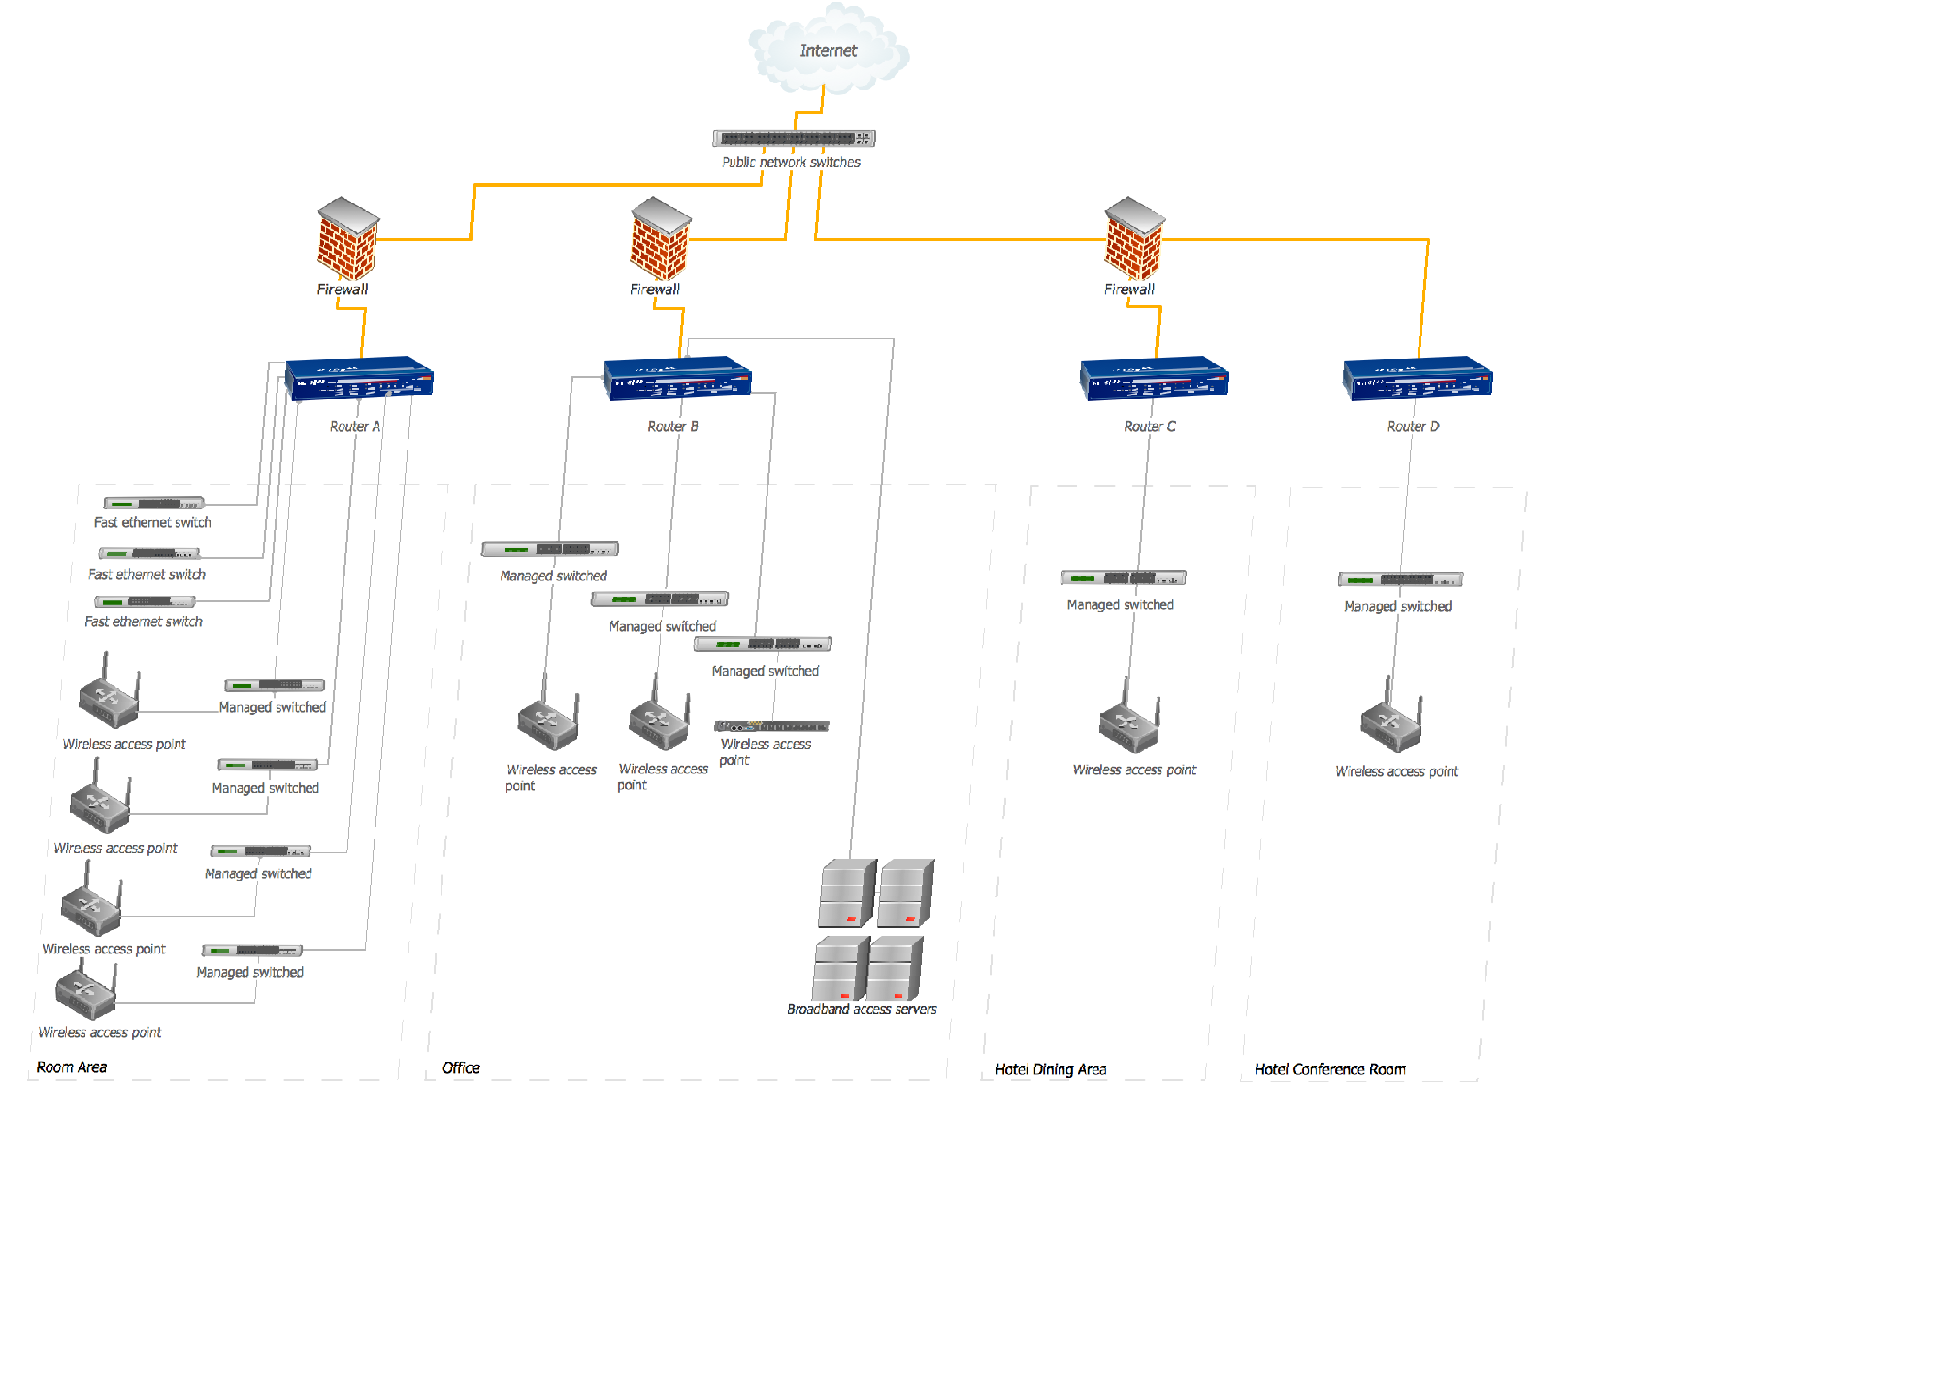
Use it to draw the physical and logical network topology diagrams for wired and wireless computer communication networks.
Network Diagram Software. LAN Network Diagrams. Physical Office Network Diagrams

Entity Relationship Diagram - ERD - Software for Design Crows Foot ER Diagrams
_Win_Mac.png)

Example of DFD for Online Store (Data Flow Diagram)

Example of DFD for Online Store shows the Data Flow Diagram for online store and interactions between the Visitors, Customers and Sellers, as well as Website Information and User databases.

Network Visualization with ConceptDraw DIAGRAM

- Network Game Diagram
- Online Gaming Network Diagram
- Lan Game Network Diagram
- Entity Relationship Diagram For Online Multi Player Game
- Design elements - AWS Mobile Services and Game Development ...
- AWS Architecture Diagrams | Design elements - AWS Mobile ...
- Chen's ERD of MMORPG | Top 5 Android Flow Chart Apps | Food ...
- Computer Network Diagrams | Network Diagramming Software for ...
- Example of DFD for Online Store (Data Flow Diagram ) DFD ...
- Build Block Game Diagram
- ERD | Entity Relationship Diagrams, ERD Software for Mac and Win
- Flowchart | Basic Flowchart Symbols and Meaning
- Flowchart | Flowchart Design - Symbols, Shapes, Stencils and Icons
- Flowchart | Flow Chart Symbols
- Electrical | Electrical Drawing - Wiring and Circuits Schematics
- Flowchart | Common Flowchart Symbols
- Flowchart | Common Flowchart Symbols