Local area network (LAN). Computer and Network Examples
 diagram")
ConceptDraw - Perfect Network Diagramming Software with examples of LAN Diagrams. ConceptDraw Network Diagram is ideal for network engineers and network designers who need to draw Local Area Network diagrams.

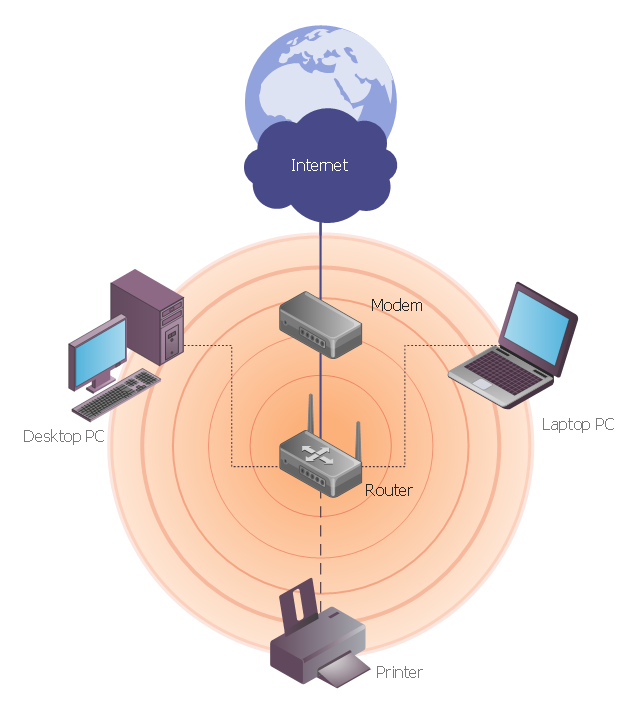
This network diagram sample depicts usage of wireless access point.
"In computer networking, a wireless access point (AP) is a device that allows wireless devices to connect to a wired network using Wi-Fi, or related standards. The AP usually connects to a router (via a wired network) as a standalone device, but it can also be an integral component of the router itself. ...
With the creation of the wireless Access Point (AP), network users are now able to add devices that access the network with few or no cables. An AP normally connects directly to a wired Ethernet connection and the AP then provides wireless connections using radio frequency links for other devices to utilize that wired connection. Most APs support the connection of multiple wireless devices to one wired connection. Modern APs are built to support a standard for sending and receiving data using, these radio frequencies. Those standards, and the frequencies they use are defined by the IEEE. Most APs use IEEE 802.11 standards." [Wireless access point. Wikipedia]
The wireless network diagram example "Wireless access point" was created using the ConceptDraw PRO diagramming and vector drawing software extended with the Wireless Networks solution from the Computer and Networks area of ConceptDraw Solution Park.
Wireless network diagram
UML Use Case Diagram Example. Social Networking Sites Project

This sample shows the Facebook Socio-health system and is used at the projection and creating of the social networking sites.
 AWS Architecture Diagrams
AWS Architecture Diagrams with powerful drawing tools and numerous predesigned Amazon icons and AWS simple icons is the best for creation the AWS Architecture Diagrams, describing the use of Amazon Web Services or Amazon Cloud Services, their application for development and implementation the systems running on the AWS infrastructure. The multifarious samples give you the good understanding of AWS platform, its structure, services, resources and features, wide opportunities, advantages and benefits from their use; solution’s templates are essential and helpful when designing, description and implementing the AWS infrastructure-based systems. Use them in technical documentation, advertising and marketing materials, in specifications, presentation slides, whitepapers, datasheets, posters, etc.
Fishbone Diagram Problem Solving

To design easily the Fishbone diagram, you can use a special ConceptDraw DIAGRAM vector graphic and diagramming software which contains the powerful tools for Fishbone diagram problem solving offered by Fishbone Diagrams solution for the Management area of ConceptDraw Solution Park.
Process Flow Diagram Symbols

ER Diagram for Cloud Computing

How To Create a Bubble Chart

Using ConceptDraw you will be able to create a bubble chart from the ready ConceptDraw library objects or make your own objects. The created diagram can represent ideas organization, in brainstorming processes, by teachers for explaining difficult ideas or for presentations.
UML Diagrams with ConceptDraw DIAGRAM

ConceptDraw DIAGRAM is a software that provides possibility of detailed UML diagrams. A large number of stencils that coresponds to UML diagram notation and task-oriented templates.
 Venn Diagrams
Venn Diagrams are actively used to illustrate simple set relationships in set theory and probability theory, logic and statistics, mathematics and computer science, linguistics, sociology, and marketing. Venn Diagrams are also often used to visually summarize the status and future viability of a project.
- Diagram Physical Topologies | Physical LAN topology diagram ...
- ER diagram tool for OS X | Best Vector Drawing Application for Mac ...
- HVAC Plans | Office Layout Plans | Network Layout Floor Plans | A ...
- Hybrid satellite and common carrier network diagram | Network ...
- Design Element: Rack Diagram for Network Diagrams | Value ...
- Network Gateway Router | ConceptDraw Arrows10 Technology ...
- Cisco Network Templates | Network Diagram Examples | Diagram Of ...
- Universal Diagramming Area | Engineering | Network Diagram ...
- Top 5 Android Flow Chart Apps | Diagramm Tool
- Cause and effect diagram - Increase in productivity | Home area ...
- ERD | Entity Relationship Diagrams, ERD Software for Mac and Win
- Flowchart | Basic Flowchart Symbols and Meaning
- Flowchart | Flowchart Design - Symbols, Shapes, Stencils and Icons
- Flowchart | Flow Chart Symbols
- Electrical | Electrical Drawing - Wiring and Circuits Schematics
- Flowchart | Common Flowchart Symbols
- Flowchart | Common Flowchart Symbols