Types of Flowcharts
A Flowchart is a graphically representation of the process, algorithm or the step-by-step solution of the problem. There are ten types of Flowcharts. Using the Flowcharts solution from the Diagrams area of ConceptDraw Solution Park you can easy and quickly design the Flowchart of any of these types.
Basic Diagramming Flowchart Software
ConceptDraw PRO is a powerful intelligent vector graphics tool for drawing flowcharts.ConceptDraw PRO Compatibility with MS Visio
For those who are migrating from MS Visio to ConceptDraw PRO, or for those who have colleagues and clients who use Visio, ConceptDraw PRO is compatible with MS Visio .VSDX formatted files..VSDX is Visio’s open XML file format, and it can be easily imported and exported by ConceptDraw PRO.DFD Library — Design elements
Three DFD libraries, 49 vector shapes. Use these DFD symbol libraries to design the process-oriented models, data-oriented models, data flowcharts, data process diagrams, structured analysis diagrams, and information flow diagrams.Process Flow Diagram Symbols
Chemical and Process Engineering Solution from the Industrial Engineering Area of ConceptDraw Solution Park is a unique tool which contains variety of predesigned process flow diagram symbols for easy creating various Chemical and Process Flow Diagrams in ConceptDraw PRO.Optimize a Workflow
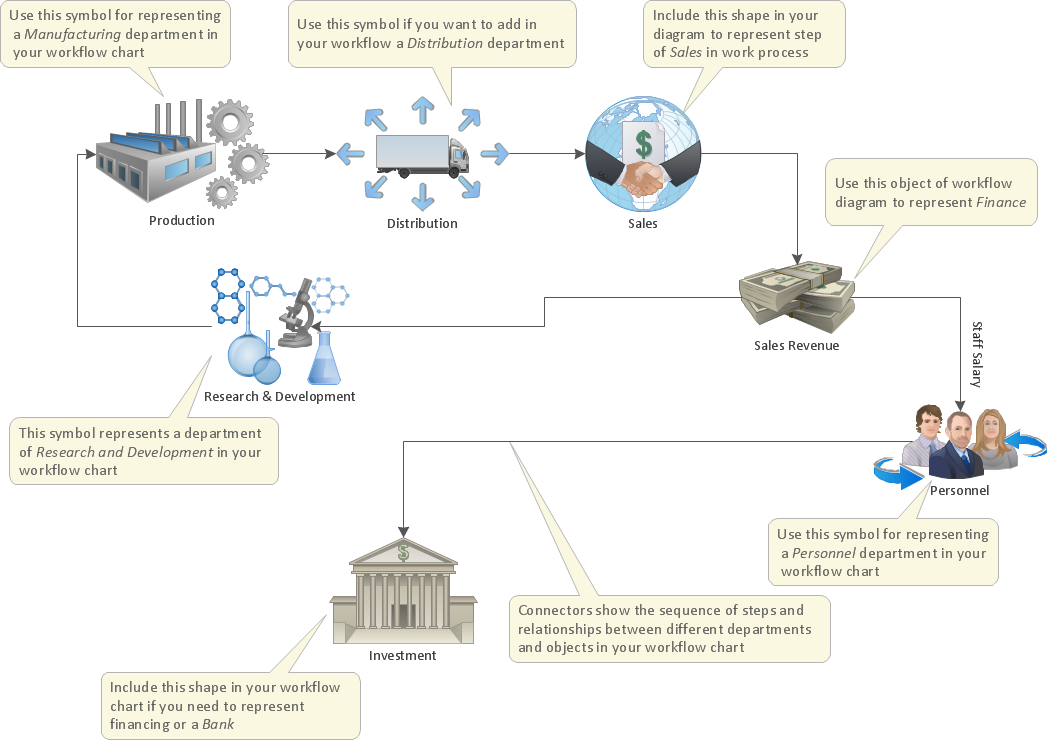
The first step to optimize a workflow is to get its visual depiction. Then you can analyse and optimize the workflow making changes to your workflow diagram. We recommend to use ConceptDraw PRO software extended with the Workflow Diagram solution to visualize and optimize your workflow. It allows you produce easy-to-change scalable vector graphic workflow and then present it to your team or partners.How to Draw a Good Diagram of a Business Workflow?
To draw a good diagram of a business workflow you should have a ready-to-use set of pre-designed objects you may drag-and-drop to your document focusing on the workflow structure and meaning, not drawing tools. ConceptDraw PRO with Workflow Diagrams solution provides complete set of design element you may use to draw a good diagram of a business workflow.Affinity Diagram
The affinity diagram is a business tool used to organize ideas and data. It is one of the Seven Management and Planning Tools. But how design the Affinity Diagram quick and easy? ConceptDraw PRO diagramming and vector drawing software offers the Seven Management and Planning Tools Solution from the Management Area.Scrum process work items and workflow
Teams working with Scrum methodology use the product backlog items (PBIs), bug work item types (WITs), reports and dashboards. SCRUM Workflow solution for ConceptDraw PRO software offers collection of samples, variety of predesigned objects, clipart and graphic elements, a set of Scrum process work items and workflow which are developed for agile teams working using Scrum.Cross-Functional Process Map Template
When you need a drawing software to create a professional looking cross-functional charts, ConceptDraw with its Arrows10 Technology - is more than enough versatility to draw any type of diagram with any degree of complexity.Use templates with process maps, diagrams, charts to get the drawing in minutes.
Workflow to Make a Purchase. Accounting Flowchart Example
Purchasing Workflow Chart as a methods for documenting accounting information systems. Symbols and Methods for designing Accounting System.Think. Act. Accomplish.
ConceptDraw MINDMAP is ready to provide you with mind mapping tool which can serve as comprehensive productivity tool for your business.Pyramid Diagram
The Project Management Triangle Diagram depicts three main constraints of any project: scope, time and cost. Projects have to comply with the specified scope, projects should be finished in time and projects need to consume the budget. Each of the constraints represents one side of the triangle, and any change in budget or timing or scope affects the entire diagram.- Natural Resource And Development Flow Chart
- Make A Flow Chart Classifying Various Natural Resources With ...
- Natural Resources Flow Chat
- Flow Chart Of Natural Resources With Meaning And Examples
- Landscape Plan | Flowchart Of Natural And Human Made Resources
- How To Start Natural Resource Using Diagram
- How To Prepare A Pie Chart To Show The Natural Resources ...
- Flow Chart Of Classification Of Natural Resources
- Type Of Natural Resources Flow Chart
- Flow Chat Classification Of Natural Resources And Human Resources
- Human Resource Development | Basic Flowchart Symbols and ...
- Flow Chart Of Natural Human Made And Human Resources
- Flowchart To Show The Different Ways In Which The Various ...
- Human Resource Development | HR Flowchart Symbols | HR ...
- Natural Resources And Human Resources Diagram
- Human Resource Development | Basic Flowchart Symbols and ...
- Energy resources diagram
- Flow Chart For Natural Resources
- Basic Flowchart Symbols and Meaning | Human Resource ...
- Human Resource Development | How to Plan and Allocate ...
- ERD | Entity Relationship Diagrams, ERD Software for Mac and Win
- Flowchart | Basic Flowchart Symbols and Meaning
- Flowchart | Flowchart Design - Symbols, Shapes, Stencils and Icons
- Flowchart | Flow Chart Symbols
- Electrical | Electrical Drawing - Wiring and Circuits Schematics
- Flowchart | Common Flowchart Symbols
- Flowchart | Common Flowchart Symbols


