HelpDesk
How to Manage Multiple Projects on Windows
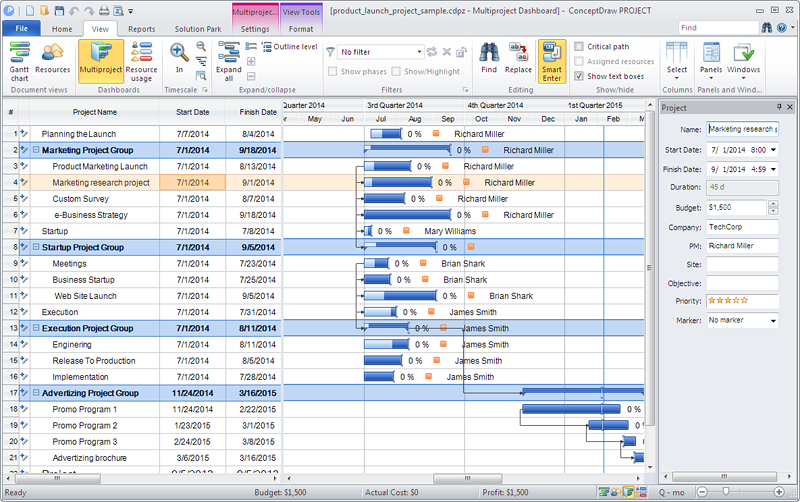
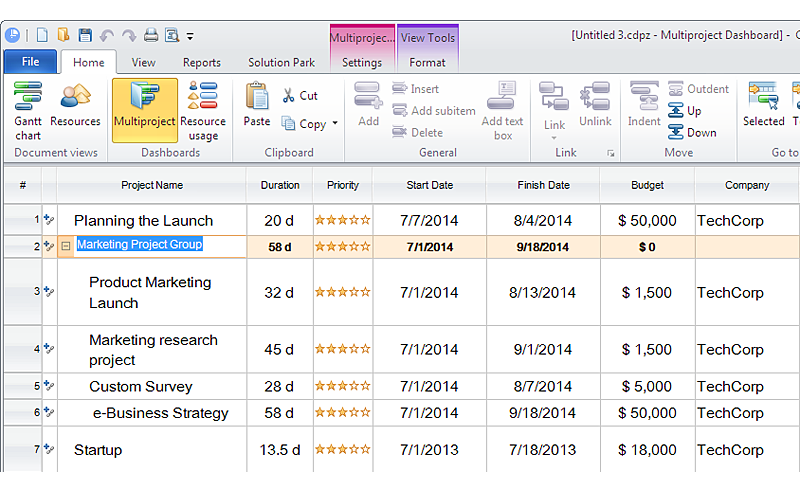
ConceptDraw PROJECT lets you to track multiple projects at the same time.HelpDesk
How to Create Multple Projects Schedule on Windows
ConceptDraw PROJECT is simple project scheduling software, it allows grouping individual projects into a multiple project that can use a common resource pool and a synchronized task schedule. You can create a detailed schedule of your multiple project quickly and easy with ConceptDraw PROJECT. When considering project change requests, project manager can model their interaction by grouping or dividing into sub-projects. It include useful critical path scheduling software tools. Multiproject Dashboard enables planning and managing several projects simultaneously using the single resource pool for all projects. The Multiproject Dashboard helps you plan multiple projects while providing you with overall view.Project — Assigning Resources
Users new to ConceptDraw PROJECT will find the Basic lessons an essential platform for familiarizing themselves with the program′s functions. Learn how to assign resources to tasks in ConceptDraw PROJECT with this comprehensive video lesson.
A KPI Dashboard Provides the Answers Your Sales Team
Sales dashboard is a tool that provides the answers to all questions your sales team may have. A mature sales dashboard provides complete set of KPI to shows corporate, team or personal performance to keep sales process clear.How To Create Project Report
ConceptDraw PROJECT contains an extensive tool set to help project managers. The rich data visualization capability that is provided by ConceptDraw products helps you create project dashboards, one-click reports, multi-project views, Gantt charts, and resource views. Let′s learn how to get maximum value using ConceptDraw PROJECT!HelpDesk
How to Create Multiple Projects Schedule on OS X
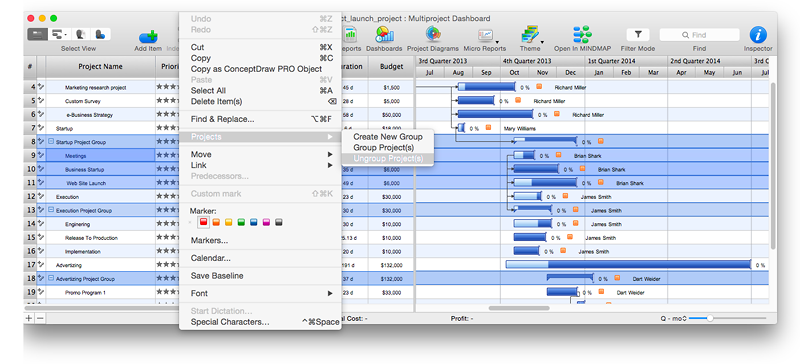
You can create a detailed schedule of your project quickly and easy with ConceptDraw PROJECT. It is easy to use the Multiproject Dashboard to plan multiple projects as if were a single one.Reporting Dashboard Software for Business
An effective way to improve your business is using reporting dashboard software. ConceptDraw PRO software extended with the Sales Dashboard solution helps you monitor all KPI on the one screen in real time.What Constitutes a Project?
Separated into categories of Basic, Intermediate, and Advanced categories, the new instructional videos about ConceptDraw PROJECT cover a huge breadth of topics. Users new to ConceptDraw PROJECT will find the Basic lessons an essential platform for familiarizing themselves with the programs′s functions. This video lesson is the first in Basic lessons series.
Gantt Chart Software
ConceptDraw PROJECT is a powerful Gantt Chart Software. The Gantt Charts are useful for displaying a large amount of detailed information, project tasks and timelines in a visually pleasing, easy-to-understand format.ConceptDraw PROJECT provides wide capabilities of importing and exporting in various formats: Microsoft Project, ConceptDraw MINDMAP, Mindjet MindManager, PDF file.
Project — Working With Costs
ConceptDraw PROJECT delivers a rich set of built-in functionalities and optional product extensions that support your daily workflow in time-saving and creative ways. This video lesson will teach you how to work with costs in your project document.Project — Working With Tasks
A full-featured project management solution with all the necessary functions right at your fingertips. Generates an extensive variety of reports on project and task statuses.These videos provide a series of lessons that will enhance the understanding of all our users, from people just starting out with the software, through to expert users.
The Facts and KPIs
Visualizing sales data help you see the facts and KPIs about your sales process to make conclusions and see how your business can improve.How to Report Task's Execution with Gantt Chart
ConceptDraw PROJECT’s powerful reporting engine lets you generate a set of tabular reports with just one click, or visualize your project as Radial Tasks Structures, Work Breakdown Structures and Resource Calendars. It also provides you with dynamic Project Dashboards.Cross Functional Flowchart Examples
Take a look on an example of Cross-Functional-Flowchart, showing the software service cross-function process flowcharts among the different departments. It presents a simple flowchart among the customer, sales, technical support, tester and development.Try now Flowchart Software and Cross-Functional library with 2 libraries and 45 vector shapes of the Cross-Functional Flowcharts solution. Then you can use built-in templates to create and present your software service cross-function process flowcharts.
Gantt Chart Templates
Gantt Chart Templates - PM Easy Solution from the Project Management Area extends ConceptDraw PROJECT with the ability to quickly start a project. It lists task dependencies and relationships making the terative planning easy.ConceptDraw PROJECT lets you the useful possibility to create visual project dashboards and diagrams, generate various kinds of reports with one click. It provides also extensive capabilities of importing and exporting in various formats: Microsoft Project, ConceptDraw MINDMAP, Mindjet MindManager, PDF file.
- Multiple Project Dashboard Template Excel
- How to Report on Multiple Projects Status | PM Dashboards | Project ...
- How to Create Project Dashboard on Mac | How to Create Multiple ...
- Project Dashboard For Multiple Projects
- How to Manage Multiple Projects on Windows | PM Dashboards ...
- How to Report on Multiple Projects Status | Project management ...
- PM Dashboards | How to Manage Multiple Projects on Windows ...
- Multi Projects Dashboard
- How to Create Project Dashboard on Mac | How to Manage Multiple ...
- Status Dashboard | Project management task status dashboard ...
- Project Dashboard Examples Free
- Project tasks dashboard | Project — Working With Costs | How to ...
- Status Dashboard | How to Create Presentation of Your Project ...
- Multi Project Dashboard Templates Doc
- PM Dashboards | Status Dashboard | How To Create Project Report ...
- How to Report on Multiple Projects Status | How to Manage Multiple ...
- Excel Dashboard Multiple Projects Tracking
- How to Manage Multiple Projects on Windows | How to View Tasks ...
- Project Dashboard Excel
- How to Create Multiple Projects Schedule on OS X | How to Create ...
- ERD | Entity Relationship Diagrams, ERD Software for Mac and Win
- Flowchart | Basic Flowchart Symbols and Meaning
- Flowchart | Flowchart Design - Symbols, Shapes, Stencils and Icons
- Flowchart | Flow Chart Symbols
- Electrical | Electrical Drawing - Wiring and Circuits Schematics
- Flowchart | Common Flowchart Symbols
- Flowchart | Common Flowchart Symbols


