 Sales Dashboard
Sales Dashboard solution extends ConceptDraw DIAGRAM software with templates, samples and library of vector stencils for drawing the visual dashboards of sale metrics and key performance indicators (KPI).
 HR Dashboard
The HR Dashboard solution extends ConceptDraw DIAGRAM functionality with powerful drawing tools and great collection of comprehensive vector design elements, icons, pictograms and objects, navigation elements, live objects of HR charts, HR indicators, and thematic maps. The range of HR Dashboards applications is extensive, among them the human resource management, recruitment, hiring process, human resource development. ConceptDraw DIAGRAM software is perfect for creation HR Dashboard with any goal you need. It gives you all opportunities for designing not only informative, but also professional looking and attractive HR Dashboards of any style and degree of detalization, that are perfect for using in presentations, reports and other thematic documents.
Sales Dashboard
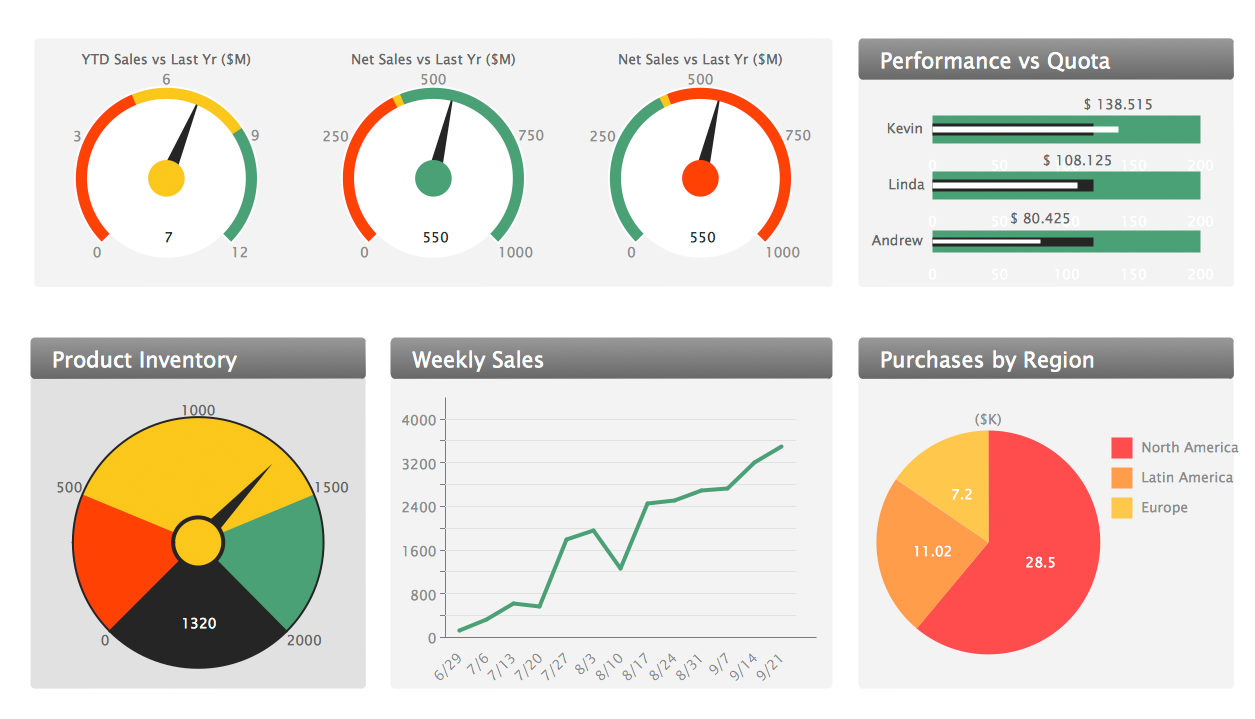
ConceptDraw DIAGRAM software extended with Sales Dashboard solution from the Marketing area of ConceptDraw Solution Park is effective for visualizing sales data, all set of KPIs on the Sales Dashboard with purpose to see how your business develops and to make conclusions for improvement the sales.
KPI Dashboard

 Target and Circular Diagrams
This solution extends ConceptDraw DIAGRAM software with samples, templates and library of design elements for drawing the Target and Circular Diagrams.
Dashboard

Performance Indicators

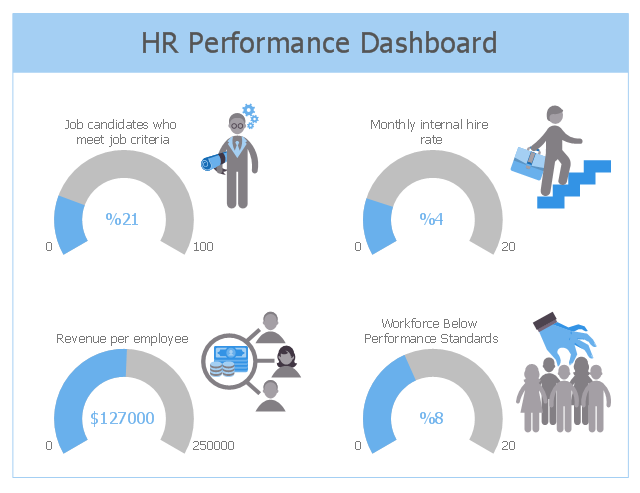
This HR dashboard sample depicts KPIs: job candidates who meet job criteria, monthly internal hire rate, revenue per employee, workforce below performance standards.
"Dashboards often provide at-a-glance views of KPIs (key performance indicators) relevant to a particular objective or business process (e.g. sales, marketing, human resources, or production).
... a human resources dashboard may show numbers related to staff recruitment, retention and composition, for example number of open positions, or average days or cost per recruitment." [Dashboard (business). Wikipedia]
The human resources dashboard example "HR Performance Dashboard" was designed using ConceptDraw PRO software extended with HR Dashboard solution from Management area of ConceptDraw Solution Park.
KPIs dashboard
 Calendars
Calendars solution extends ConceptDraw DIAGRAM software with templates, samples and library of vector stencils for drawing the business calendars and schedules.
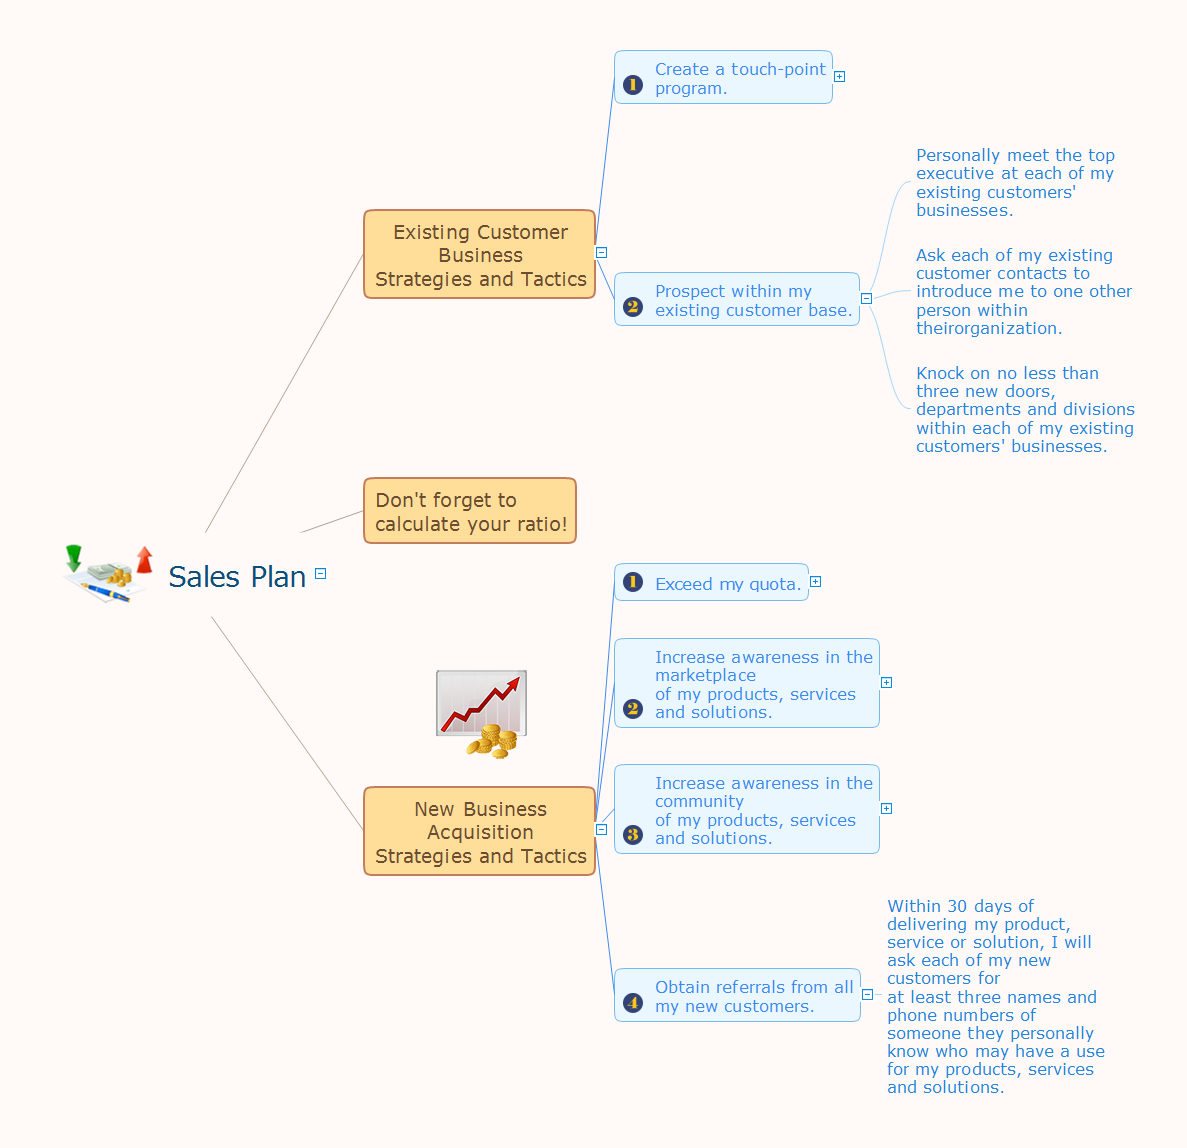
Sales Plan
- Sales Dashboard | Target and Circular Diagrams | Flowchart For ...
- Monthly Sales Dashboard
- Calendars | PM Planning | Sales Dashboard | Monthly Calendar 2013
- Target and Circular Diagrams | Free Printable Monthly Calendar 2016
- Sales Growth. Bar Graphs Example | Create Graphs and Charts ...
- Sales KPI Dashboards | What is a KPI? | The Facts and KPIs | Kpi ...
- Sales Dashboard Template | KPI Dashboard | KPIs and Metrics | Ppt ...
- Sales Dashboard - Access Anywhere | Business Intelligence ...
- Calendars Monthly
- Sales Dashboard Template | Project task status dashboard ...
- ERD | Entity Relationship Diagrams, ERD Software for Mac and Win
- Flowchart | Basic Flowchart Symbols and Meaning
- Flowchart | Flowchart Design - Symbols, Shapes, Stencils and Icons
- Flowchart | Flow Chart Symbols
- Electrical | Electrical Drawing - Wiring and Circuits Schematics
- Flowchart | Common Flowchart Symbols
- Flowchart | Common Flowchart Symbols