Pyramid Diagram

This hexagon diagram sample was redesigned from the Wikipedia file: Vicious circle in macroeconomics.svg. "An example of the use of a vicious circle in macroeconomics." [en.wikipedia.org/ wiki/ File:Vicious_ circle_ in_ macroeconomics.svg]
"A virtuous circle and a vicious circle (also referred to as virtuous cycle and vicious cycle) are economic terms. They refer to a complex chain of events that reinforces itself through a feedback loop. A virtuous circle has favorable results, while a vicious circle has detrimental results.
Both circles are complexes of events with no tendency towards equilibrium (at least in the short run). Both systems of events have feedback loops in which each iteration of the cycle reinforces the previous one (positive feedback). These cycles will continue in the direction of their momentum until an external factor intervenes and breaks the cycle. The prefix "hyper-" is sometimes used to describe these cycles if they are extreme. The best-known example of a vicious circle is hyperinflation. ...
Example in macroeconomics.
Vicious circle.
Hyperinflation is a spiral of inflation which causes even higher inflation. The initial exogenous event might be a sudden large increase in international interest rates or a massive increase in government debt due to excessive spendings. Whatever the cause, the government could pay down some of its debt by printing more money (called monetizing the debt). This increase in the money supply could increase the level of inflation. In an inflationary environment, people tend to spend their money quickly because they expect its value to decrease further in the future. They convert their financial assets into physical assets while their money still has some purchasing power. Often they will purchase on credit. Eventually, the currency loses all of its value. Because of this, the level of savings in the country is very low and the government could have problems refinancing its debt. Its solution could be to print still more money starting another iteration of the vicious cycle." [Virtuous circle and vicious circle. Wikipedia]
The crystal diagram example "Vicious circle" was created using the ConceptDraw PRO diagramming and vector drawing software extended with the Target and Circular Diagrams solution from the Marketing area of ConceptDraw Solution Park.
www.conceptdraw.com/ solution-park/ marketing-target-and-circular-diagrams
Hexagon diagram

Basic Flowchart Symbols and Meaning


Audit Flowchart Symbols

Audit Flowchart Symbols - It’s efficiently to use the colors creating the audit flowcharts to make them bright, visual, attractive and successful. The best flowchart maker use ConceptDraw PRO features of RapidDraw technique.
Flow Chart Symbols

Flowchart diagrams consists of symbols of process, decision, data and document, data base, termination or initiation processes, processing loops and conditions. To create an drawn flowchart use professional flowchart maker of ConceptDraw PRO.
The vector stencils library "IVR business" contains 28 interactive voice response (IVR) business icons.
Use it to design your IVR diagrams with ConceptDraw PRO diagramming and vector drawing software.
The vector stencils library "IVR business" is included in the Interactive Voice Response Diagrams solution from the Computer and Networks area of ConceptDraw Solution Park.
Use it to design your IVR diagrams with ConceptDraw PRO diagramming and vector drawing software.
The vector stencils library "IVR business" is included in the Interactive Voice Response Diagrams solution from the Computer and Networks area of ConceptDraw Solution Park.
Archive

Badge
Briefcase

Building

Bullhorn

Calendar

Card index

Clock

Contract

Delivery

Idea

Info

Letter

Line graph

Megaphone

Money

Note

Office building

Opened letter

Plane

Quality

Security camera

Send mail

Send message

Shopping bag

Storage cabinet

Task list

Urgent letter

The vector stencils library "Currency" contains 28 currency and money icons.
Use it to design your business and finance illustrations and infographics with ConceptDraw PRO diagramming and vector drawing software.
The vector stencils library "Currency" is included in the Business and Finance solution from the Illustration area of ConceptDraw Solution Park.
Use it to design your business and finance illustrations and infographics with ConceptDraw PRO diagramming and vector drawing software.
The vector stencils library "Currency" is included in the Business and Finance solution from the Illustration area of ConceptDraw Solution Park.
Dollar

Euro

Pound

Yen

Dollar banknotes

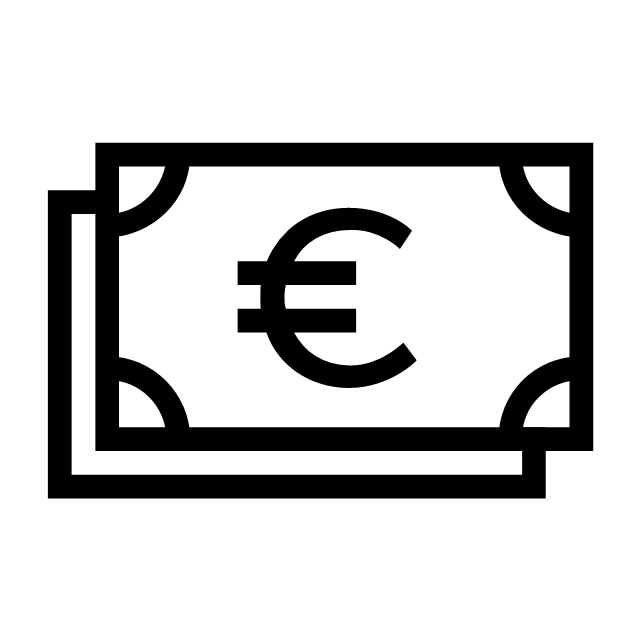
Euro banknotes
Pound banknotes

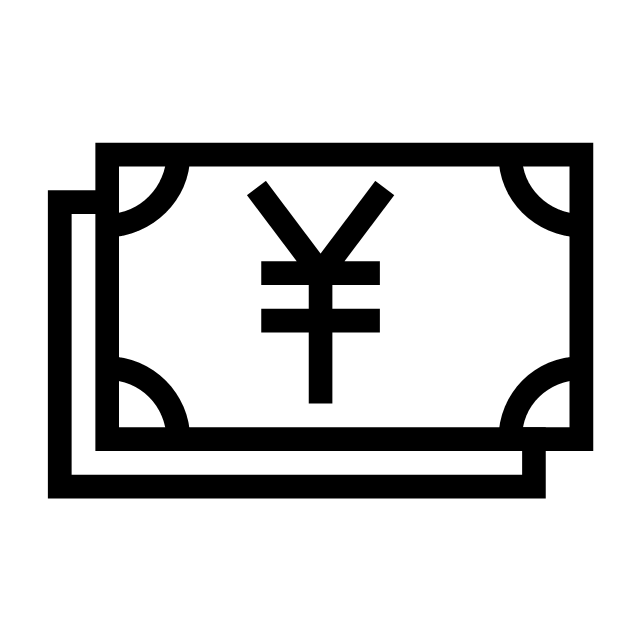
Yen banknotes
Coins

Money bags

Money in jar

Credit cards

Money box

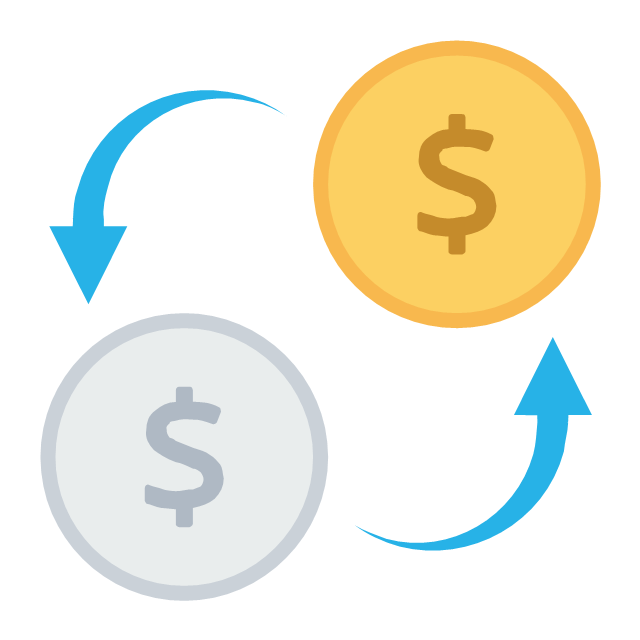
Financial transaction
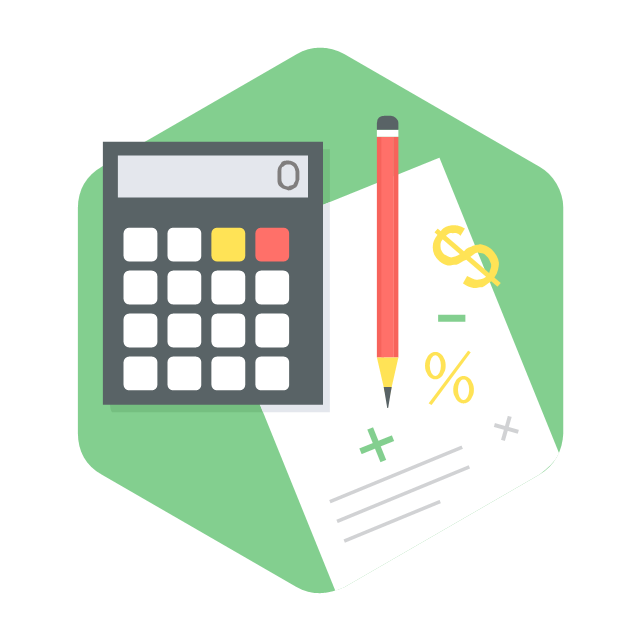
Calculation
Budget measures

Financial growth

Cash register finance calculation

Electronic funds

Credit card payment

Cash payment

Donation

Cheque book

Invoice

Money management

Time is money

Estimate

Financial security

The vector stencils library "Currency" contains 28 currency and money icons.
Use it to design your business and finance illustrations and infographics with ConceptDraw PRO diagramming and vector drawing software.
The vector stencils library "Currency" is included in the Business and Finance solution from the Illustration area of ConceptDraw Solution Park.
Use it to design your business and finance illustrations and infographics with ConceptDraw PRO diagramming and vector drawing software.
The vector stencils library "Currency" is included in the Business and Finance solution from the Illustration area of ConceptDraw Solution Park.
Dollar
Euro
Pound
Yen
Dollar banknotes
Euro banknotes
Pound banknotes
Yen banknotes
Coins
Money bags
Money in jar
Credit cards
Money box
Financial transaction
Calculation
Budget measures
Financial growth
Cash register finance calculation
Electronic funds
Credit card payment
Cash payment
Donation
Cheque book
Invoice
Money management
Time is money
Estimate
Financial security
The vector stencils library "Finance" contains 16 finance icons.
Use it to design your financial computing and telecom illustrations and infographics with ConceptDraw PRO diagramming and vector drawing software.
The vector stencils library "Finance" is included in the Computers and Communications solution from the Illustration area of ConceptDraw Solution Park.
Use it to design your financial computing and telecom illustrations and infographics with ConceptDraw PRO diagramming and vector drawing software.
The vector stencils library "Finance" is included in the Computers and Communications solution from the Illustration area of ConceptDraw Solution Park.
Growth chart

Currency

Credit cards

Finance planning

Funds

Bank storage

Safe box

Bank

Transaction

Accounting

Send money

Receive money

Wallet

Marketplace

Case

Award

- Donation Icon Png
- Exchange Money Png Vector
- Active Directory Diagrams | Ads Image Png
- IVR business - Vector stencils library | Shake Hand Icon Png
- Vicious circle - Crystal diagram | Geo Map - Europe - France ...
- Time, quality, money triangle diagram | Time - Vector stencils library ...
- Cash Vector Png
- Pay Money Logo Vector
- Business - Vector stencils library | Shake Hand Png
- Currency - Vector stencils library | Financial Transaction Vector Png
- ERD | Entity Relationship Diagrams, ERD Software for Mac and Win
- Flowchart | Basic Flowchart Symbols and Meaning
- Flowchart | Flowchart Design - Symbols, Shapes, Stencils and Icons
- Flowchart | Flow Chart Symbols
- Electrical | Electrical Drawing - Wiring and Circuits Schematics
- Flowchart | Common Flowchart Symbols
- Flowchart | Common Flowchart Symbols