Example of DFD for Online Store (Data Flow Diagram)

Example of DFD for Online Store shows the Data Flow Diagram for online store and interactions between the Visitors, Customers and Sellers, as well as Website Information and User databases.

 Telecommunication Network Diagrams
Telecommunication Network Diagrams solution extends ConceptDraw DIAGRAM software with samples, templates, and great collection of vector stencils to help the specialists in a field of networks and telecommunications, as well as other users to create Computer systems networking and Telecommunication network diagrams for various fields, to organize the work of call centers, to design the GPRS networks and GPS navigational systems, mobile, satellite and hybrid communication networks, to construct the mobile TV networks and wireless broadband networks.
Entity Relationship Diagram - ERD - Software for Design Crows Foot ER Diagrams
_Win_Mac.png)

Mesh Network Topology Diagram
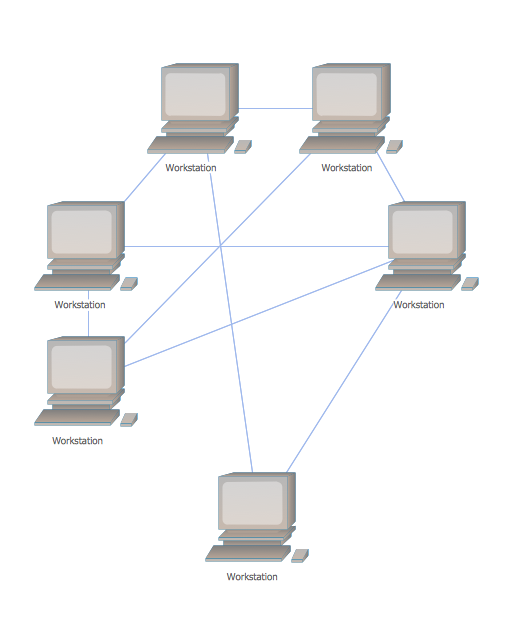
The Mesh Network Topology Diagram examples was created using ConceptDraw DIAGRAM software with Computer and Networks solution.
Sales Process Flowchart Symbols

 AWS Architecture Diagrams
AWS Architecture Diagrams with powerful drawing tools and numerous predesigned Amazon icons and AWS simple icons is the best for creation the AWS Architecture Diagrams, describing the use of Amazon Web Services or Amazon Cloud Services, their application for development and implementation the systems running on the AWS infrastructure. The multifarious samples give you the good understanding of AWS platform, its structure, services, resources and features, wide opportunities, advantages and benefits from their use; solution’s templates are essential and helpful when designing, description and implementing the AWS infrastructure-based systems. Use them in technical documentation, advertising and marketing materials, in specifications, presentation slides, whitepapers, datasheets, posters, etc.
 Interactive Voice Response Diagrams
Interactive Voice Response Diagrams solution extends ConceptDraw DIAGRAM software with samples, templates and libraries of ready-to-use vector stencils that help create Interactive Voice Response (IVR) diagrams illustrating in details a work of interactive voice response system, the IVR system’s logical and physical structure, Voice-over-Internet Protocol (VoIP) diagrams, and Action VoIP diagrams with representing voice actions on them, to visualize how the computers interact with callers through voice recognition and dual-tone multi-frequency signaling (DTMF) keypad inputs.
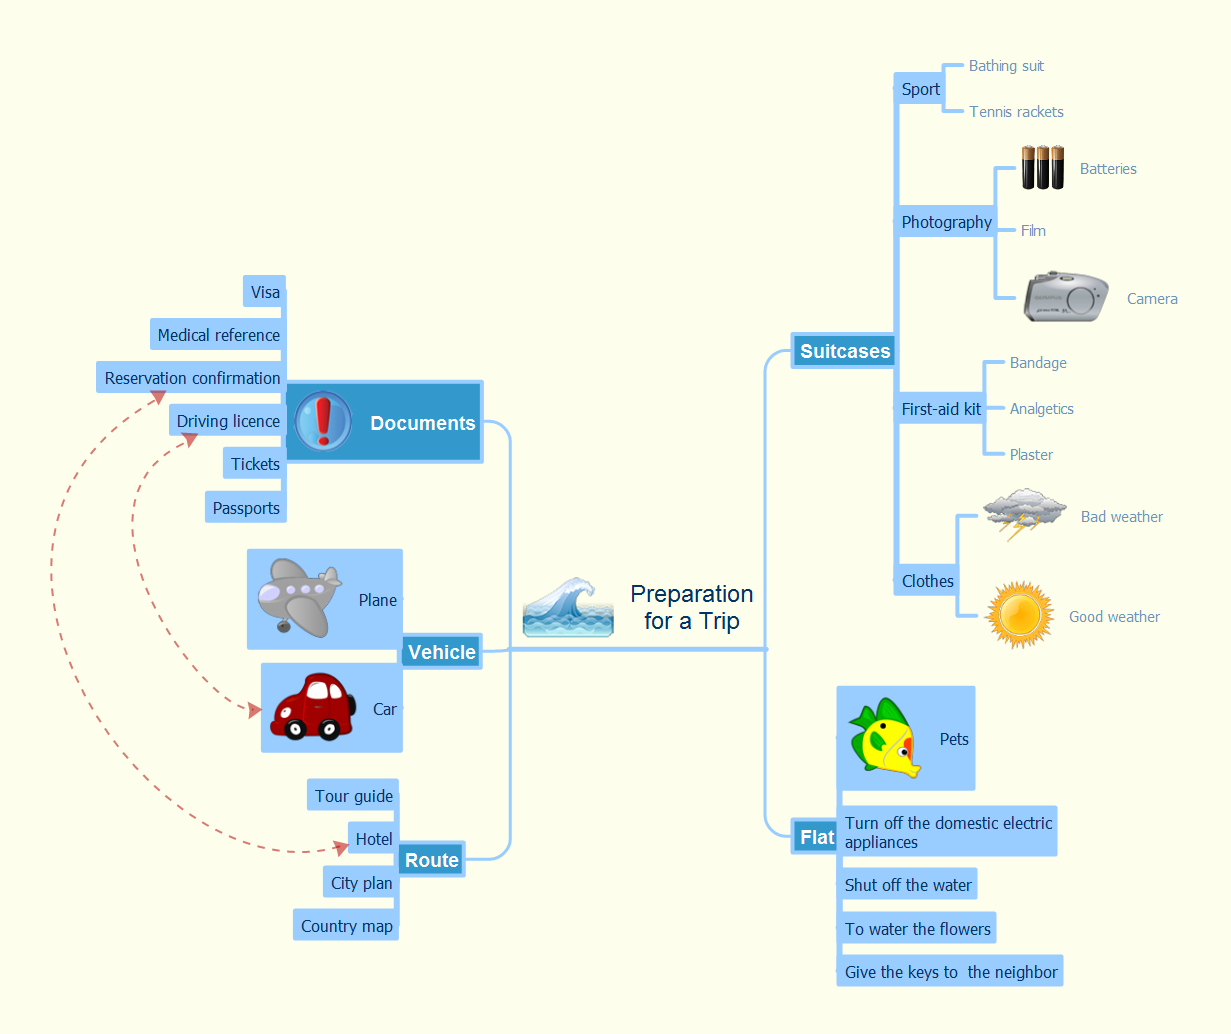
Take Notes Exchanging Mind Maps with Evernote
Project —Task Trees and Dependencies

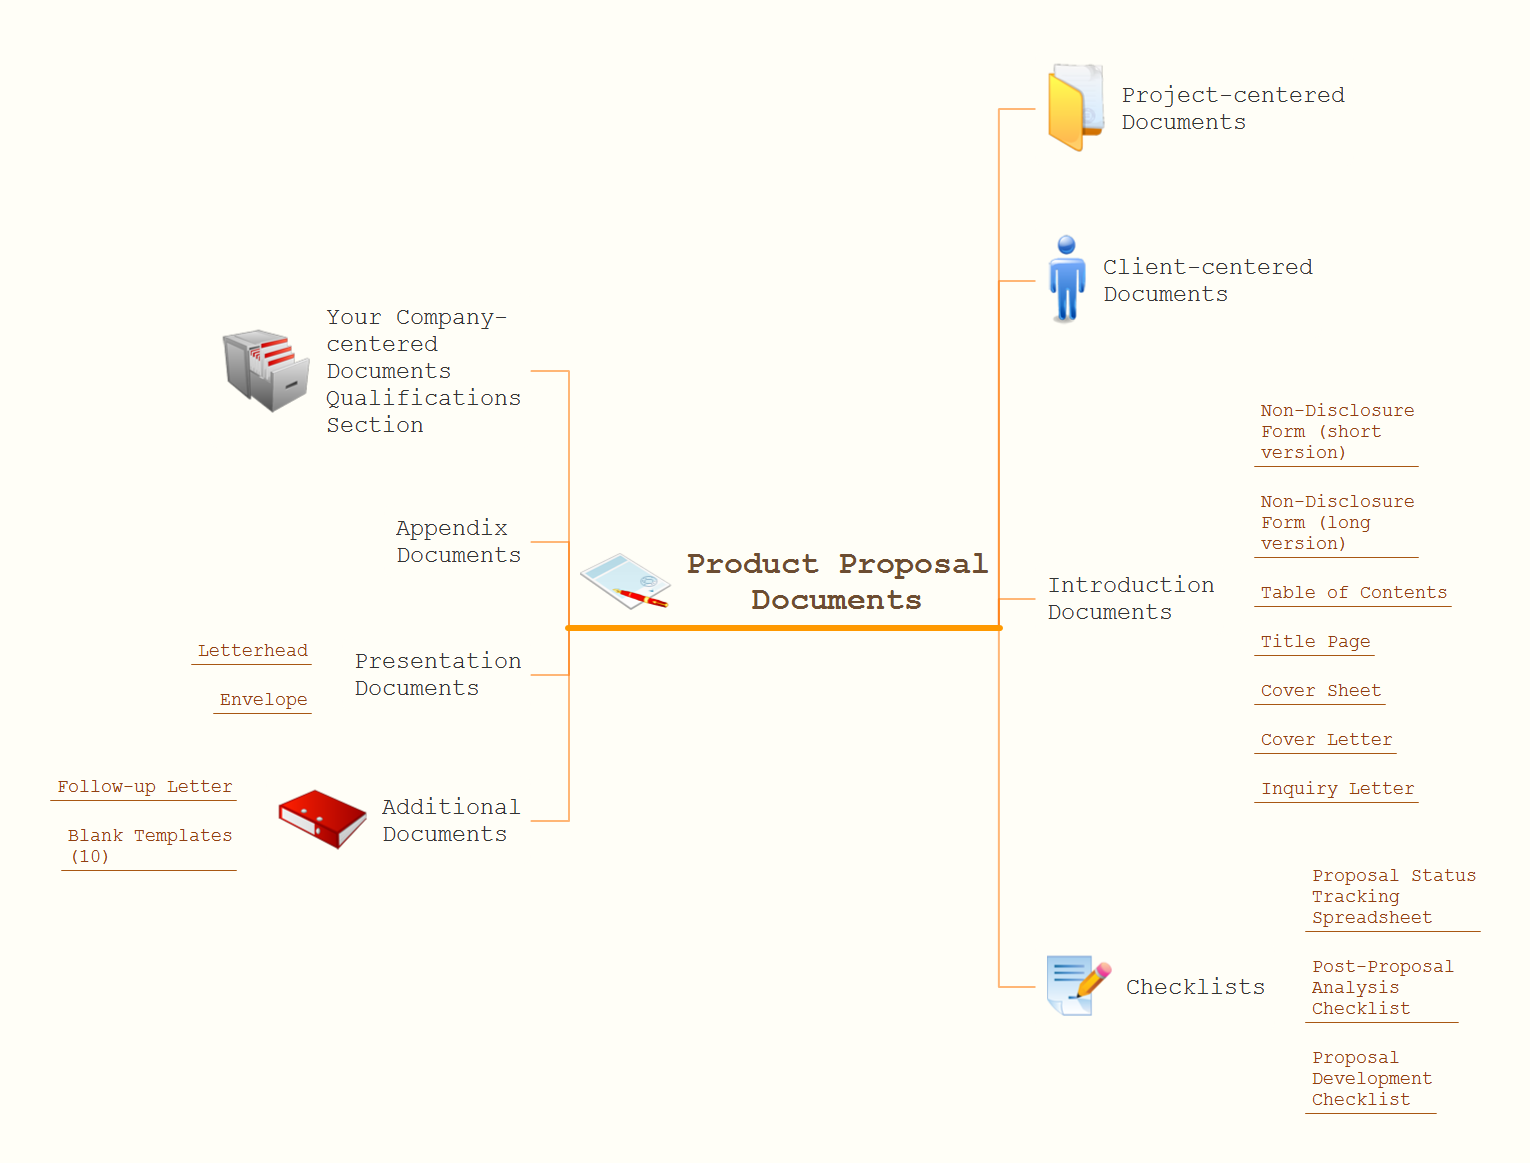
UML Sample Project

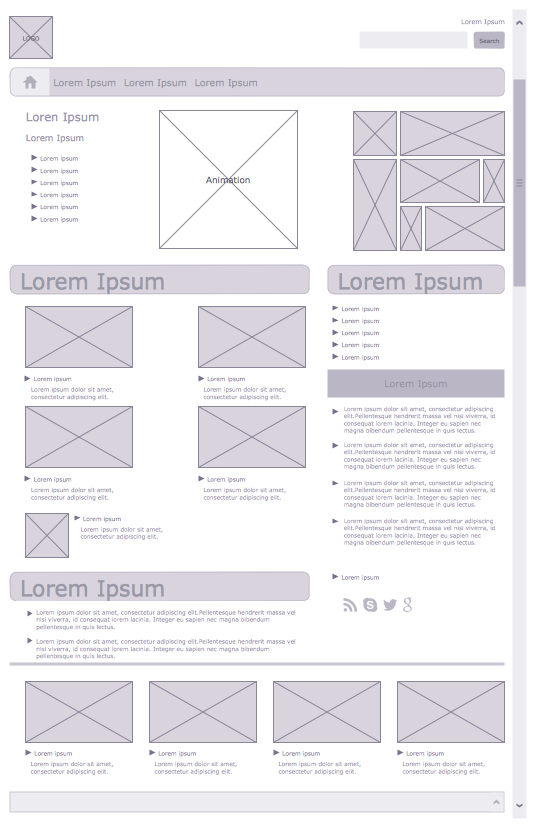
Wireframe Examples
Detail Specifications Exchanging Mind Maps with Evernote
 Event-driven Process Chain Diagrams
Event-Driven Process Chain Diagrams solution extends ConceptDraw DIAGRAM functionality with event driven process chain templates, samples of EPC engineering and modeling the business processes, and a vector shape library for drawing the EPC diagrams and EPC flowcharts of any complexity. It is one of EPC IT solutions that assist the marketing experts, business specialists, engineers, educators and researchers in resources planning and improving the business processes using the EPC flowchart or EPC diagram. Use the EPC solutions tools to construct the chain of events and functions, to illustrate the structure of a business process control flow, to describe people and tasks for execution the business processes, to identify the inefficient businesses processes and measures required to make them efficient.
 Computers and Communications
Computers and communications solution extends ConceptDraw DIAGRAM software with illustration samples, templates and vector stencils libraries with clip art of computers, control devices, communications, technology, Apple machines.
- Data Flow Diagram For Android Mobile Applications
- Example For Small Data Flow Diagram
- Over View Diagram In Online Mobile Shopping
- Example of DFD for Online Store ( Data Flow Diagram ) DFD ...
- Store Layout Software | Example of DFD for Online Store ( Data Flow ...
- Structured Systems Analysis and Design Method (SSADM) with ...
- Example of DFD for Online Store ( Data Flow Diagram ) DFD ...
- Example of DFD for Online Store ( Data Flow Diagram ) DFD ...
- Example of DFD for Online Store ( Data Flow Diagram ) DFD ...
- Example of DFD for Online Store ( Data Flow Diagram ) DFD ...
- Online Mobile Shop Relation Of Structured Analysis Components Dfd
- Diagram Of Mobile Buying Selling System
- Example of DFD for Online Store ( Data Flow Diagram ) DFD ...
- Data Flow Diagram Model | Basketball Court Diagram and ...
- Data Flow Diagram Service Station
- Taxi Service Data Flow Diagram DFD Example | Taxi order process ...
- Data Flow Diagram Examples For Android Application
- ConceptDraw PRO ER Diagram Tool | Example of DFD for Online ...
- Dfd For Mobile Money System
- Online store social media response flowchart | Example of DFD for ...
- ERD | Entity Relationship Diagrams, ERD Software for Mac and Win
- Flowchart | Basic Flowchart Symbols and Meaning
- Flowchart | Flowchart Design - Symbols, Shapes, Stencils and Icons
- Flowchart | Flow Chart Symbols
- Electrical | Electrical Drawing - Wiring and Circuits Schematics
- Flowchart | Common Flowchart Symbols
- Flowchart | Common Flowchart Symbols