Risk Diagram (Process Decision Program Chart)

CORRECTIVE ACTIONS PLANNING. Risk Diagram (PDPC)


Risk Diagram (Process Decision Program Chart)

The PDPC determines the risks when corrective action is not performed correctly. Also, it helps develop descriptions for preventive actions at the level of execution.
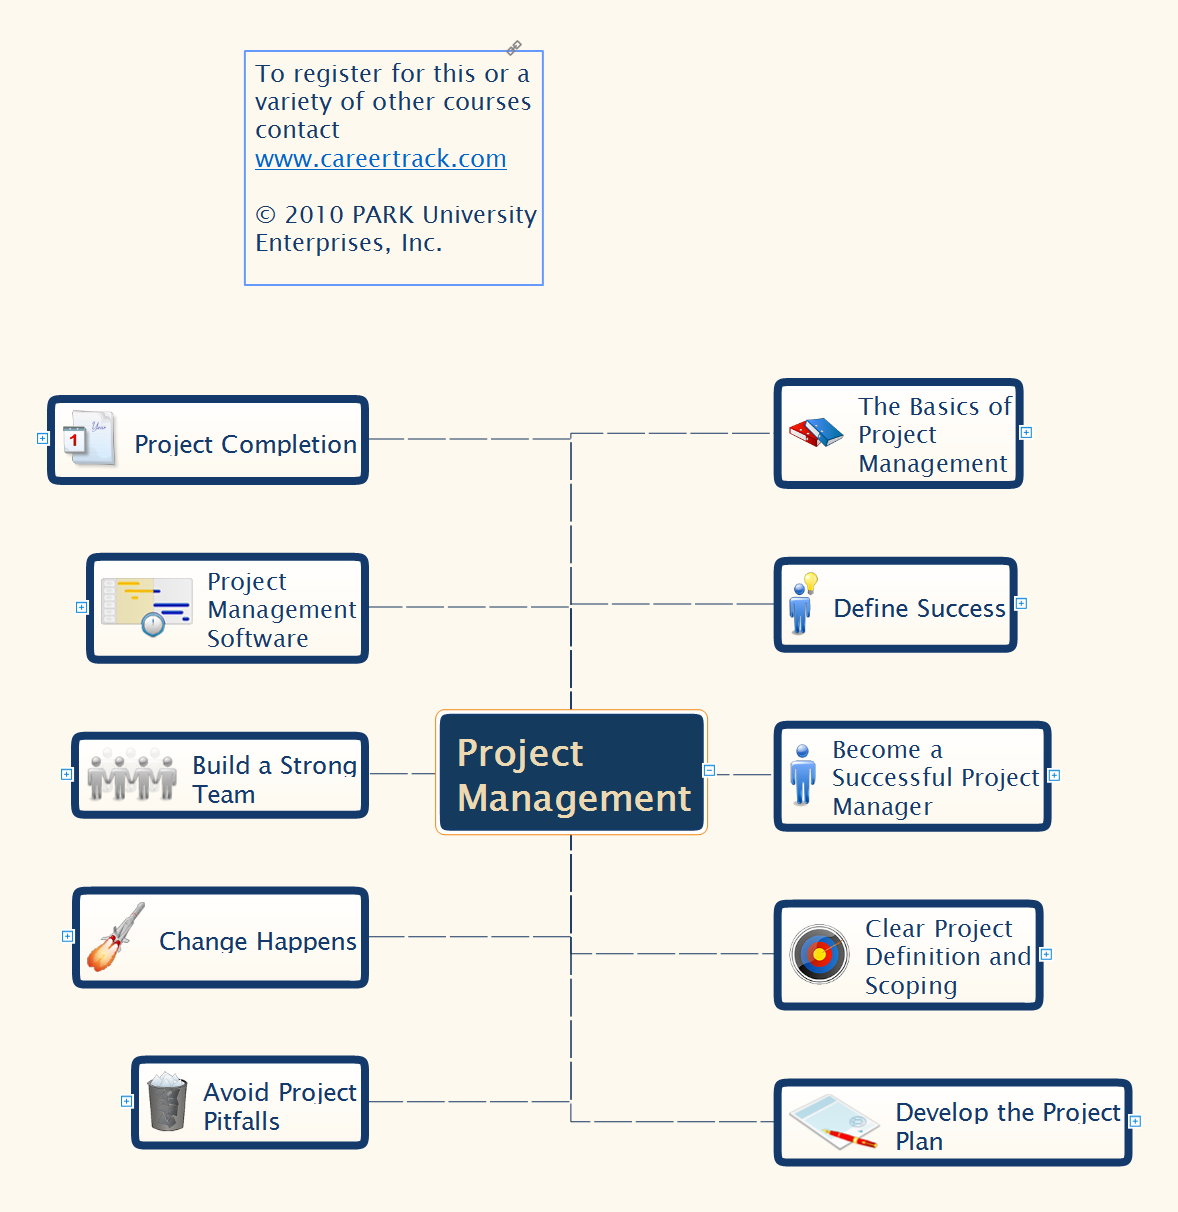
Project Management
Affinity Diagram

Internal Audit Process

ConceptDraw DIAGRAM diagramming and vector drawing software extended with Audit Flowcharts solution from the Finance and Accounting area perfectly suits for the Internal Audit Process. You can make sure this right now!
PDPC

Best Flowcharts

Conceptdraw DIAGRAM - feature-rich flowchart software. It will allow you to create professional looking flowcharts.
SWOT analysis Software & Template for Macintosh and Windows

UML Diagram Visio

Using the 13 libraries of the Rapid UML Solution for ConceptDraw DIAGRAM you can create your own visual vector UML diagrams quick and easy.
- Concept Map Of Management
- Risk management - Concept map | How To Make a Concept Map ...
- Risk management - Concept map | Concept Map In Liabilities
- Concept Map Risk Management
- Risk management - Concept map | Types of Flowchart - Overview ...
- Mind Map Risk Assessment
- Calendars | Risk management - Concept map | Think. Act ...
- Mind Map About Disaster Risk Management
- Risk management - Concept map | Concept Maps | Cross ...
- Concept Map Management
- ERD | Entity Relationship Diagrams, ERD Software for Mac and Win
- Flowchart | Basic Flowchart Symbols and Meaning
- Flowchart | Flowchart Design - Symbols, Shapes, Stencils and Icons
- Flowchart | Flow Chart Symbols
- Electrical | Electrical Drawing - Wiring and Circuits Schematics
- Flowchart | Common Flowchart Symbols
- Flowchart | Common Flowchart Symbols