This site uses cookies. By continuing to browse the ConceptDraw site you are agreeing to our Use of Site Cookies.

PROBLEM ANALYSIS. Prioritization Matrix

ConceptDraw OFFICE suite is a software for Prioritization Matrix diagram making. This diagram ranks the drivers’ factors to determine priority. It identifies the factors of the first priority for analysis of possible corrective actions. It assesses the weight of each factor for each criterion and specifies it in the Prioritization Matrix. The total sum of weights for a factor’s criteria indicates its priority.
7MP Tools
7MP Tools

Affinity Diagram

The Affinity Diagram shows the structure of large, complex factors that have an influence on a problem, and then divides them up into a smaller and simpler structure. The Affinity Diagram does not show a causal relationship between the factors. This diagram is designed to prepare the data for further analysis of the cause-effect relationships.

Root Cause Tree Diagram

Analyze the root causes of factors that influence the problem. A diagram is constructed separately for each high priority factor. Identify the root causes for a factor and then propose possible corrective actions. The diagram displays the structure of causes for a factor and possible corrective actions. The Root Cause Analysis Tree Diagram is used for further formulation of actions.

Decision Making

Decision Making - ConceptDraw OFFICE suite provides visual tools that are given support on the stage of the decision making.
The Seven Management and Planning Tools is a set for such diagrams: Affinity Diagram, Relations Diagram, Prioritization Matrix, Root Cause Tree Diagram, Involvement Matrix, PERT Chart, Risk Diagram (PDPC).
HelpDesk

How To Create Root Cause Analysis Diagram Using Solutions

Root Cause Analysis diagram is used to analyze the root causes of factors that influence the problem. If the certain factor is the root cause, this mean that its vanishing will help to prevent the further recurrence of the problem. Root Cause diagram helps to identify the root causes for a factor and then propose possible corrective actions. A diagram is constructed separately for each high priority factor. The ability to create a RCA tree diagram from a mind map is supported by the ConceptDraw Seven Management and Planning Tools solution.

Think and act effectively

Many people who use mind mapping software for personal organizing find ConceptDraw MINDMAP sufficiently useful mind mapping tool in their business and daily life. Especially many positive responses receive ConceptDraw MINDMAP as cross platform tool to mind maps for Macintosh and Windows.

7 Management & Planning Tools

The "7 Management and Planning Tools" solution implements well-known methodologies for problem analysis and solving. Different products from the ConceptDraw Office suite can be used as a complete solution for any of the methodologies in this solution. ConceptDraw Office provides visual communication during every stage of work.

Quality Management Teams

ConceptDraw MINDMAP with Quality mindmaps solution as a demonstration of the creative approach to quality management in daily work of quality management team.

SWOT Analysis Software

SWOT Analysis solution from ConceptDraw Solution Park contains easy-to-use mind map templates that help identify Strengths, Weaknesses, Opportunities, and Threats using ConceptDraw MINDMAP software, as well as outputs to ConceptDraw DIAGRAM for presenting analysis results as SWOT and TOWS matrices.

When To Use a Fishbone Diagram

Fishbone diagrams work for most entrepreneurs and almost any industry or person having a problem. Professional diagramming software may help you create Fishbone (Cause and Effect or Ishikawa) diagrams. When people are unclear about what is causing an issue, ConceptDraw DIAGRAM will be your lifesaver.
When to use a Fishbone diagram? Originally developed as a quality control tool, you may find a Fishbone diagram helpful when used in many cases, such as to analyze a complex problem when there are many causes, for identifying all possible root causes for an effect or a problem, when you need different point of view to look on a problem, to uncover bottlenecks and identify where and why a process doesn't work, for acceleration a process when traditional ways of problem solving consume many time.
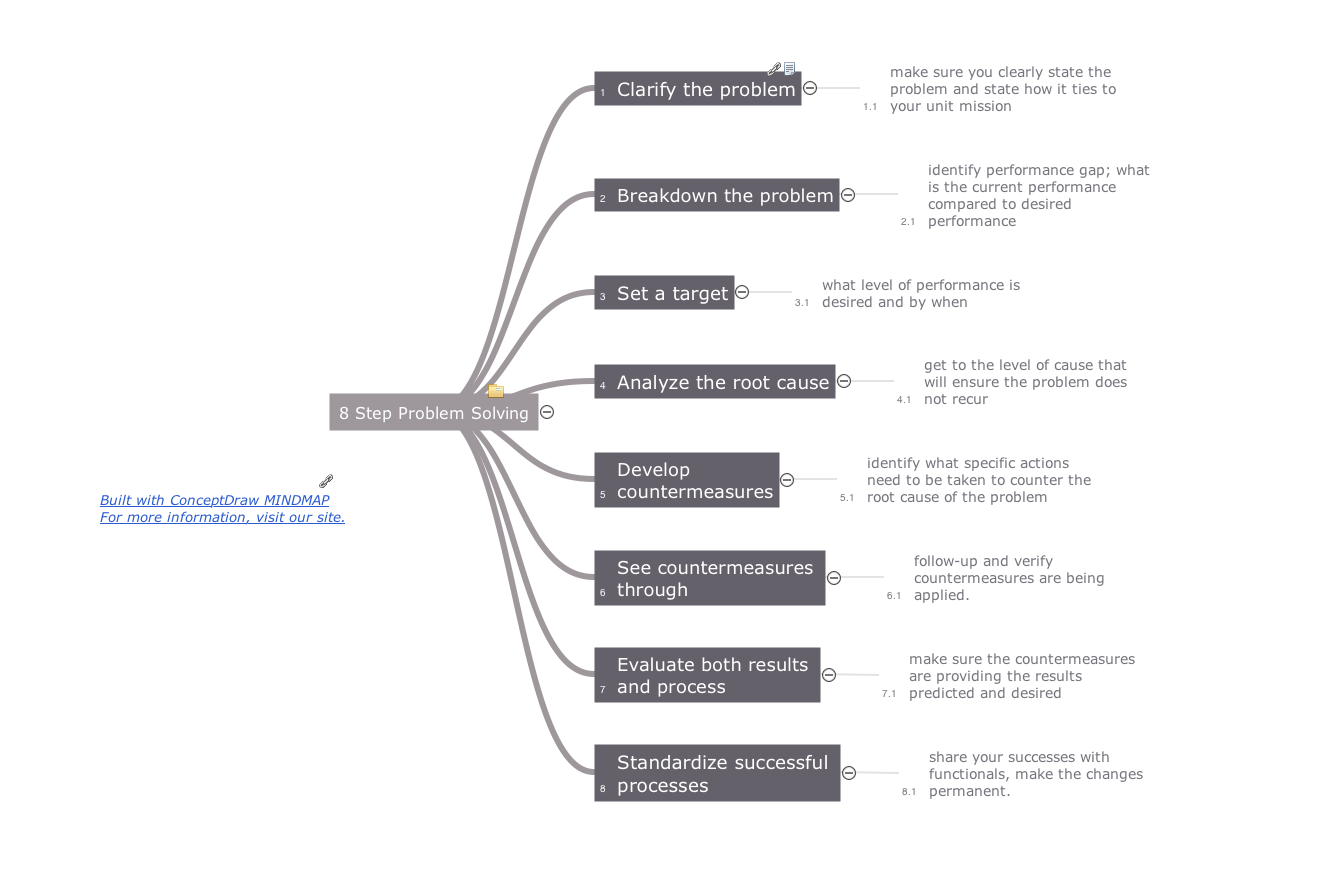