How to Create Presentation of Your Project Gantt Chart
During the planning, discussing and execution of a project you may need to prepare a presentation using project views such as the Gantt Chart, Multiproject Dashboard or Resource Usage View. It’s easy do with ConceptDraw PROJECT!Gantt Chart Templates
Gantt Chart Templates - PM Easy Solution from the Project Management Area extends ConceptDraw PROJECT with the ability to quickly start a project. It lists task dependencies and relationships making the terative planning easy.ConceptDraw PROJECT lets you the useful possibility to create visual project dashboards and diagrams, generate various kinds of reports with one click. It provides also extensive capabilities of importing and exporting in various formats: Microsoft Project, ConceptDraw MINDMAP, Mindjet MindManager, PDF file.
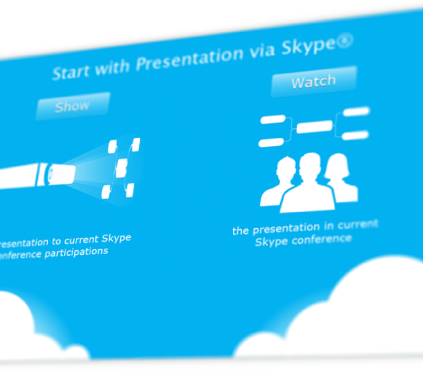
Skype Presentation
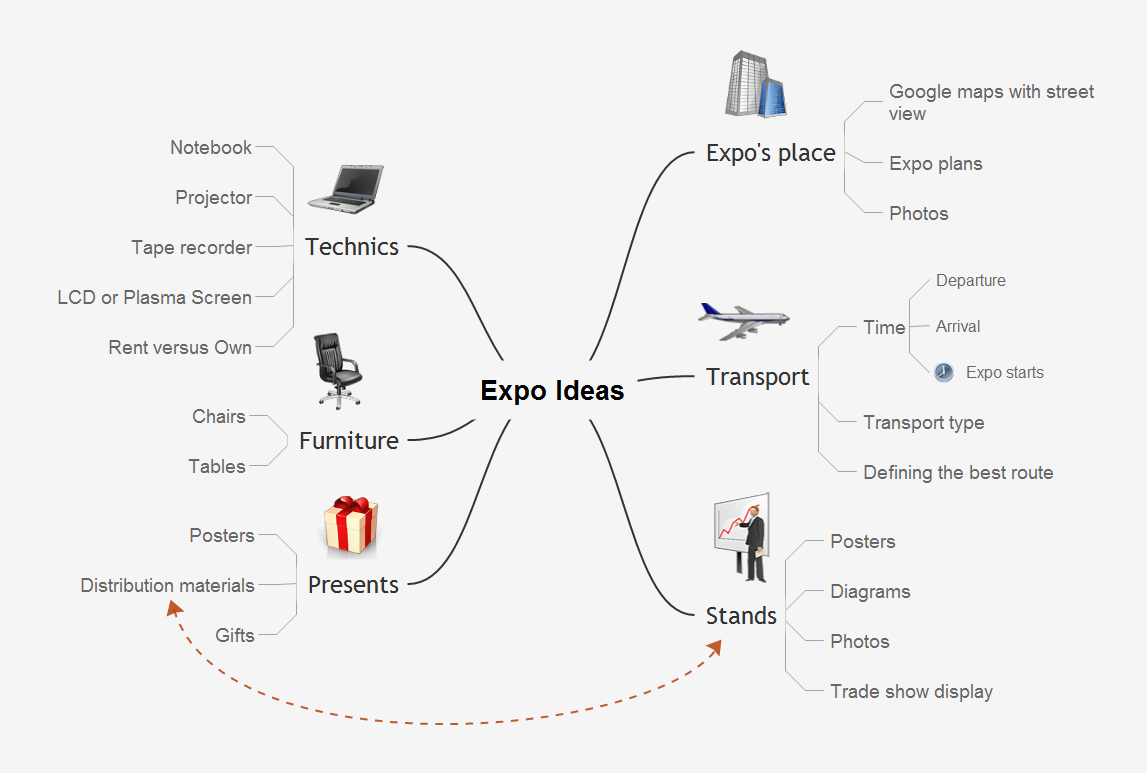
How to do Skype Presentation. Solution for ConceptDraw MindmapHow to Create a Great Presentation
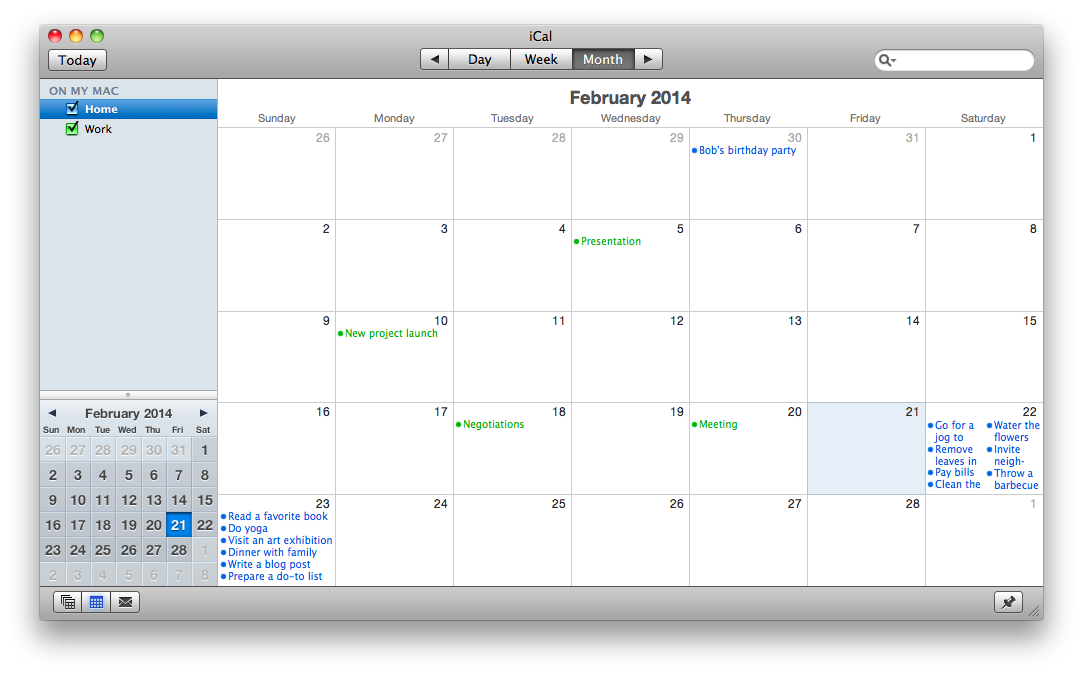
Create great presentations with ConceptDraw easily.Export from ConceptDraw MINDMAP to Apple iCal
ConceptDraw MINDMAP Mac OS X version enables you to export your mind map into the iCal calendar and generate tasks from mind map topics.Project — Working With Costs
ConceptDraw PROJECT delivers a rich set of built-in functionalities and optional product extensions that support your daily workflow in time-saving and creative ways. This video lesson will teach you how to work with costs in your project document.Demonstrating Results
ConceptDraw MINDMAP software is an advanced tool for creating presentations. You can effectively generate, change, and update your presentation for demonstrating results of your work.How To Use Skype for Business
Using Skype for Business will let you control teams and deliver information worldwide in a real-time. This is an important tool for everyday work.
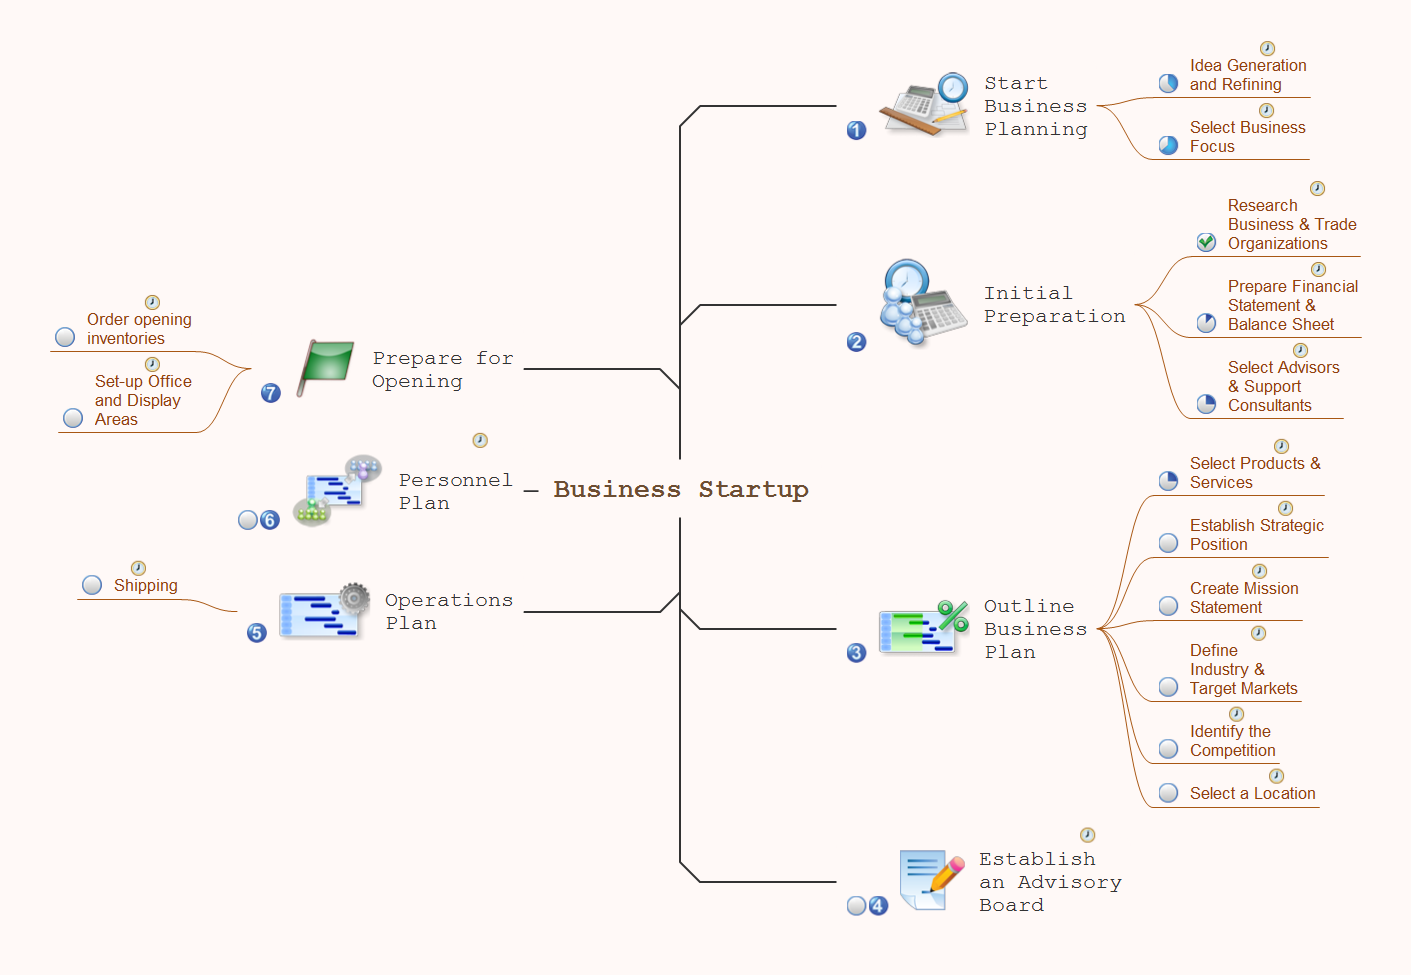
Best Software for Making Presentations
An advanced tool for creating presentations, if you decide to represent data without spending hours on that.- Mind Map Free Simple Gantt Chart Template
- Business Processes | Simple Gantt Chart Template
- Gantt charts for planning and scheduling projects | Gant Chart in ...
- How to Make a Mind Map from a Project Gantt Chart | How to Create ...
- Gantt Chart Templates | Gantt Chart Diagram | Gantt Chart Software ...
- Free Simple Gantt Chart
- How to Make a Mind Map from a Project Gantt Chart | How to Quickly ...
- Gantt Chart Templates | Gantt Chart Software | PM Easy | Easy Gantt ...
- How to Make a Mind Map from a Project Gantt Chart | Basic ...
- Microsoft Project Charts
- ERD | Entity Relationship Diagrams, ERD Software for Mac and Win
- Flowchart | Basic Flowchart Symbols and Meaning
- Flowchart | Flowchart Design - Symbols, Shapes, Stencils and Icons
- Flowchart | Flow Chart Symbols
- Electrical | Electrical Drawing - Wiring and Circuits Schematics
- Flowchart | Common Flowchart Symbols
- Flowchart | Common Flowchart Symbols


