
HelpDesk
How to Report on Project Milestones Using a Mind Map

The vector stencils library "Timelines and milestones" contains 24 shapes of timelines, time intervals, milestones.
Use it for drawing timeline and milistone diagrams in the ConceptDraw PRO diagramming and vector drawing software extended with the Timeline Diagrams solution from the Management area of ConceptDraw Solution Park.
Use it for drawing timeline and milistone diagrams in the ConceptDraw PRO diagramming and vector drawing software extended with the Timeline Diagrams solution from the Management area of ConceptDraw Solution Park.
Plane Timeline
Plane Interval

Plane Interval (Progress)
-timelines-and-milestones---vector-stencils-library.png--diagram-flowchart-example.png)
Gradient Timeline
Gradient Interval

Gradient Interval (Progress)
-timelines-and-milestones---vector-stencils-library.png--diagram-flowchart-example.png)
Stylish Timeline
Stylish Interval

Stylish Interval (Progress)
-timelines-and-milestones---vector-stencils-library.png--diagram-flowchart-example.png)
Cylindrical Timeline
Cylindrical Interval

Cylindrical Interval (Progress)
-timelines-and-milestones---vector-stencils-library.png--diagram-flowchart-example.png)
1D Timeline

Bracket interval

Diamond Milestone

Circle Milestone

X Milestone

Square Milestone

Triangle Milestone

2 Triangle Milestone

Dagger Milestone

Line Milestone

Cylindrical Milestone

Today Marker

The vector stencils library "Timelines and milestones" contains 24 shapes of time scales with start and finish dates, time interval bars with progress indication and brackets, milestone, event and today markers for drawing the timeline diagrams using the ConceptDraw PRO diagramming and vector drawing software.
"A timeline is a way of displaying a list of events in chronological order, sometimes described as a project artifact. It is typically a graphic design showing a long bar labelled with dates alongside itself and (usually) events labelled on points where they would have happened. ...
Another type of timeline is used for project management. In these cases, timelines are used to help team members to know what milestones need to be achieved and under what time schedule. For example, in the case of establishing a project timeline in the implementation phase of the life cycle of a computer system." [Timeline. Wikipedia]
The example "Design elements - Timelines solution" is included in the Timeline Diagrams solution from the Management area of ConceptDraw Solution Park.
Timeline and milestone symbols

HelpDesk
How to Create a Timeline Diagram in ConceptDraw PRO

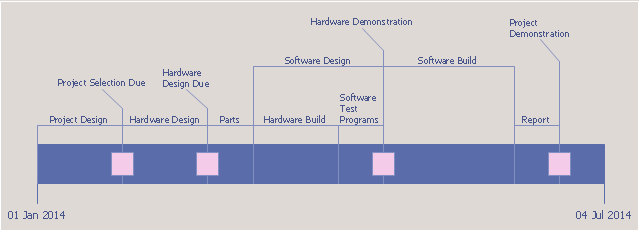
Timeline charts presents events and time periods on a chronological scale. They are used in project management to visualize project milestones and upper level phases, and show project progress.
"Within the framework of project management, a milestone is an event that receives special attention. It is often put at the end of a stage to mark the completion of a work package or phase. Milestones can be put before the end of a phase so that corrective actions can be taken, if problems arise, and the deliverable can be completed on time.
In addition to signaling the completion of a key deliverable, a milestone may also signify an important decision or the derivation of a critical piece of information, which outlines or affects the future of a project. In this sense, a milestone not only signifies distance traveled (key stages in a project) but also indicates direction of travel since key decisions made at milestones may alter the route through the project plan." [Milestone (project management). Wikipedia]
This timeline diagram example was created using the ConceptDraw PRO diagramming and vector drawing software extended with the Timeline Diagrams solution from the Management area of ConceptDraw Solution Park.
Timeline

HelpDesk
How to Create Project Diagrams on Mac

How to Report Task's Execution with Gantt Chart

Timeline charts presents events and time periods on a chronological scale. They are used in project management to visualize project milestones and upper level phases, and show project progress.
"... timeline is used for project management. In these cases, timelines are used to help team members to know what milestones need to be achieved and under what time schedule. For example, in the case of establishing a project timeline in the implementation phase of the life cycle of a computer system." [Timeline. Wikipedia]
This project timeline diagram example was created using the ConceptDraw PRO diagramming and vector drawing software extended with the Timeline Diagrams solution from the Management area of ConceptDraw Solution Park.
Project timeline
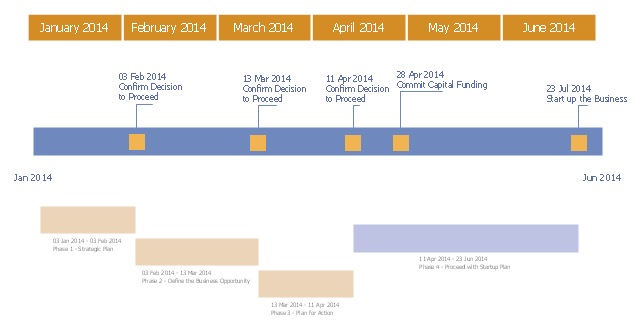
"A project plan, according to the Project Management Body of Knowledge, is: "...a formal, approved document used to guide both project execution and project control. The primary uses of the project plan are to document planning assumptions and decisions, facilitate communication among stakeholders, and document approved scope, cost, and schedule baselines. A project plan may be summarized or detailed." ...
The objective of a project plan is to define the approach to be used by the Project team to deliver the intended project management scope of the project.
At a minimum, a project plan answers basic questions about the project:
Why? - What is the problem or value proposition addressed by the project? Why is it being sponsored?
What? - What is the work that will be performed on the project? What are the major products/ deliverables?
Who? - Who will be involved and what will be their responsibilities within the project? How will they be organized?
When? - What is the project timeline and when will particularly meaningful points, referred to as milestones, be complete?" [Project plan. Wikipedia]
The timeline diagram example "New business project plan" was created using the ConceptDraw PRO diagramming and vector drawing software extended with the Timeline Diagrams solution from the Management area of ConceptDraw Solution Park.
Project timeline
The vector stencils library "Travel and tourism pictograms" contains 20 travelling and journey symbols.
Use it to draw your tour and trip infograms. The example "Travel and tourism pictograms - Vector stencils library" was created using the ConceptDraw PRO diagramming and vector drawing software extended with the Pictorial infographics solution from the area "What is infographics" in ConceptDraw Solution Park.
Use it to draw your tour and trip infograms. The example "Travel and tourism pictograms - Vector stencils library" was created using the ConceptDraw PRO diagramming and vector drawing software extended with the Pictorial infographics solution from the area "What is infographics" in ConceptDraw Solution Park.
Globe

Wind rose

Direction

Sign
Milestone

Flag

Campground

Tent

RV

Restaurant

Restrooms
Passport

Plane

Ticket

Briefcase

Case

Luggage

Mountains

Palm

Hotel

How to Make a Timeline

 Timeline Diagrams
Timeline Diagrams solution extends ConceptDraw PRO software with templates, samples and library of vector stencils for drawing the timeline and milestones diagrams.
The PERT chart shows the logical connections and consequence of a set of tasks. PERT charts the time period for problem solving and the implementation plan for all activities along the critical path. The PERT chart is also known as a precedence diagram or project network diagram.
"The Program (or Project) Evaluation and Review Technique, commonly abbreviated PERT, is a statistical tool, used in project management, that is designed to analyze and represent the tasks involved in completing a given project. ...
PERT is a method to analyze the involved tasks in completing a given project, especially the time needed to complete each task, and to identify the minimum time needed to complete the total project.
PERT was developed primarily to simplify the planning and scheduling of large and complex projects. ...
A network diagram can be created by hand or by using diagram software. There are two types of network diagrams, activity on arrow (AOA) and activity on node (AON). Activity on node diagrams are generally easier to create and interpret." [Program Evaluation and Review Technique. Wikipedia]
The PERT chart is one of the Seven Management and Planning Tools (7 MP tools, Seven New Quality Tools).
The PERT chart template for the ConceptDraw PRO diagramming and vector drawing software is included in the solution "Seven Management and Planning Tools" from the Management area of ConceptDraw Solution Park.
PERT chart template

Legend

- How to Identify Project Milestones | How to Create a Timeline ...
- Plane Travelling Png
- Wind Rose Png
- Travel Vector Png
- Mountain Vector Png
- Flight Vector Png
- Png File Stone Plan
- How to Identify Project Milestones | How to Report on Project ...
- Airplane Vector Png
- Timelines and milestones - Vector stencils library
- Tent Png Vector
- Milestone Project Management Example
- Vector Mountain Png
- How to Identify Project Milestones | How to Create a Timeline ...
- Milestone Chart
- Secure Wireless Network | Add a Telecommunication Network ...
- Design elements - Timelines and milestones | Timelines and ...
- Timelines and milestones - Vector stencils library | How to Make a ...
- Timeline Of Project Phases And Milestones
- How to Report on Project Milestones Using a Mind Map | PM Easy ...
- ERD | Entity Relationship Diagrams, ERD Software for Mac and Win
- Flowchart | Basic Flowchart Symbols and Meaning
- Flowchart | Flowchart Design - Symbols, Shapes, Stencils and Icons
- Flowchart | Flow Chart Symbols
- Electrical | Electrical Drawing - Wiring and Circuits Schematics
- Flowchart | Common Flowchart Symbols
- Flowchart | Common Flowchart Symbols