Porter's Value Chain

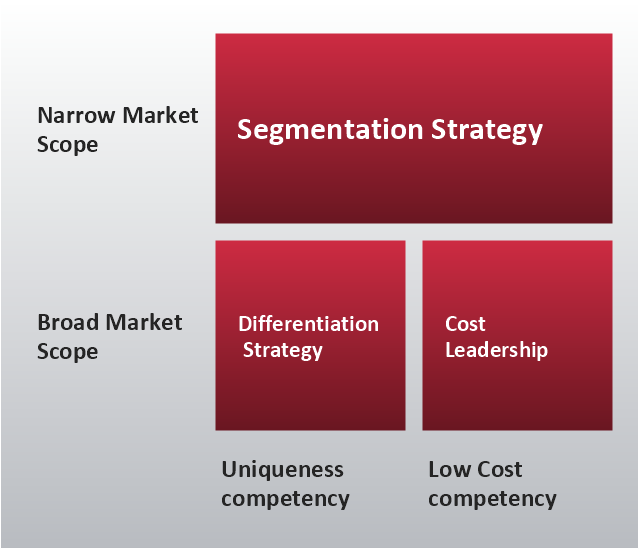
"Michael Porter has described a category scheme consisting of three general types of strategies that are commonly used by businesses to achieve and maintain competitive advantage. These three generic strategies are defined along two dimensions: strategic scope and strategic strength. Strategic scope is a demand-side dimension and looks at the size and composition of the market you intend to target. Strategic strength is a supply-side dimension and looks at the strength or core competency of the firm. In particular he identified two competencies that he felt were most important: product differentiation and product cost (efficiency)." [Porter's generic strategies. Wikipedia]
This Porter's generic strategies matrix diagram was redesigned from Wikipedia file PorterGenericStrategies.png. [en.wikipedia.org/ wiki/ File:PorterGenericStrategies.png]
This file is licensed under the Creative Commons Attribution-Share Alike 3.0 Unported license. [creativecommons.org/ licenses/ by-sa/ 3.0/ deed.en]
This Porter's generic strategies matrix diagram example was created by the ConceptDraw PRO diagramming and vector drawing software extended with the Matrices solution from the Marketing area of ConceptDraw Solution Park.
Porter's generic strategies matrix
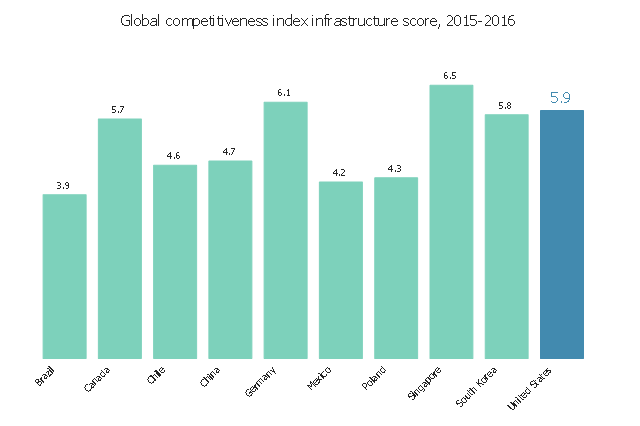
The example bar graph "Global competitiveness index infrastructure score chart, 2012-2013" was redesigned from the website "Assess Costs Everywhere" of the United States Department of Commerce. [acetool.commerce.gov/ shipping]
"The Global Competitiveness Report (GCR) is a yearly report published by the World Economic Forum. Since 2004, the Global Competitiveness Report ranks countries based on the Global Competitiveness Index, developed by Xavier Sala-i-Martin and Elsa V. Artadi. Before that, the macroeconomic ranks were based on Jeffrey Sachs's Growth Development Index and the microeconomic ranks were based on Michael Porter's Business Competitiveness Index. The Global Competitiveness Index integrates the macroeconomic and the micro/ business aspects of competitiveness into a single index." [Global Competitiveness Report. Wikipedia]
The example "Global competitiveness index infrastructure score chart, 2012-2013" was created using the ConceptDraw PRO diagramming and vector drawing software extended with the Bar Graphs solution from the Graphs and Charts area of ConceptDraw Solution Park.
www.conceptdraw.com/ solution-park/ charts-bar-graphs
Horizontal Bar Graph
- | Porter's Value Chain | Diagram Of Generic Strategies Of Michael ...
- Michael Porters Strategic Matrix
- Michael Porter Diagram Quadrant
- Porter's Value Chain | Comparing Michael Porter Model And Ansoff ...
- Michael Porter Value Chain Free Template
- What Is The Quadrant Of Michael Porter
- Porter's generic strategies matrix diagram | Block diagram - Porter's ...
- Porter's Value Chain | Flow Chart Of Michael Porter
- Porter's value chain matrix diagram
- Michael Porter S Quadrants
- Porter's generic strategies matrix diagram | Competitive strategy ...
- Competitive strategy matrix | Porter's generic strategies matrix ...
- Competitive strategy matrix
- Porter's Value Chain | Block diagram - Porter's five forces model ...
- Porter's generic strategies matrix diagram | Porter's value chain ...
- Porter's generic strategies matrix diagram | Competitive strategy ...
- Competitive strategy matrix | Porter's Value Chain | Matrices | Porters ...
- Block diagram - Porter's five forces model | Porter's value chain ...
- Porter's generic strategies matrix diagram | Matrices | Growth-Share ...
- | | Porter's Value Chain | Porters Strategic Matrix
- ERD | Entity Relationship Diagrams, ERD Software for Mac and Win
- Flowchart | Basic Flowchart Symbols and Meaning
- Flowchart | Flowchart Design - Symbols, Shapes, Stencils and Icons
- Flowchart | Flow Chart Symbols
- Electrical | Electrical Drawing - Wiring and Circuits Schematics
- Flowchart | Common Flowchart Symbols
- Flowchart | Common Flowchart Symbols