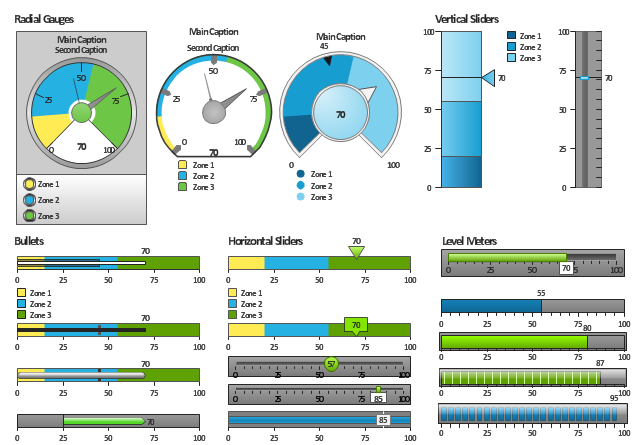
The vector stencils library "Meter indicators" contains 29 Live Objects: speedometer gauge, dial, bullet graph, slider and level meter visual indicators.
The Live Objects designed to display actual measures of performance metrics and KPIs from external data source files.
Some of them also display comparative measures, and colored zones of qualitative ranges with legend.
Use it to draw business performance dashboards using the ConceptDraw PRO diagramming and vector drawing software .
"Digital dashboards may be laid out to track the flows inherent in the business processes that they monitor. Graphically, users may see the high-level processes and then drill down into low level data. This level of detail is often buried deep within the corporate enterprise and otherwise unavailable to the senior executives. ...
Specialized dashboards may track all corporate functions. Examples include human resources, recruiting, sales, operations, security, information technology, project management, customer relationship management and many more departmental dashboards. ...
Like a car's dashboard (or control panel), a software dashboard provides decision makers with the input necessary to "drive" the business. Thus, a graphical user interface may be designed to display summaries, graphics (e.g., bar charts, pie charts, bullet graphs, "sparklines," etc.), and gauges (with colors similar to traffic lights) in a portal-like framework to highlight important information. ...
Digital dashboards allow managers to monitor the contribution of the various departments in their organization. To gauge exactly how well an organization is performing overall, digital dashboards allow you to capture and report specific data points from each department within the organization, thus providing a "snapshot" of performance." [Dashboard (management information systems). Wikipedia]
The example "Design elements - Meter indicators" is included in the Meter Dashboard solution from the area "What is a Dashboard" of ConceptDraw Solution Park.
Visual indicators

 Meter Dashboard
Meter dashboard solution extends ConceptDraw DIAGRAM software with templates, samples and vector stencils library with meter indicators for drawing visual dashboards showing quantitative data.
The vector stencils library "Meter indicators 2" (for dark background) contains 29 Live Objects: speedometer gauge, dial, bullet, slider and level meter visual indicators.
The Live Objects designed to display actual measures of performance metrics from external data source files. Some of them also display comparative measures, and colored zones of qualitative ranges with legend.
Use this library to create visual dashboards in the ConceptDraw PRO diagramming and vector drawing software extended with the Meter Dashboard solution from the area "What is a Dashboard" of ConceptDraw Solution Park.
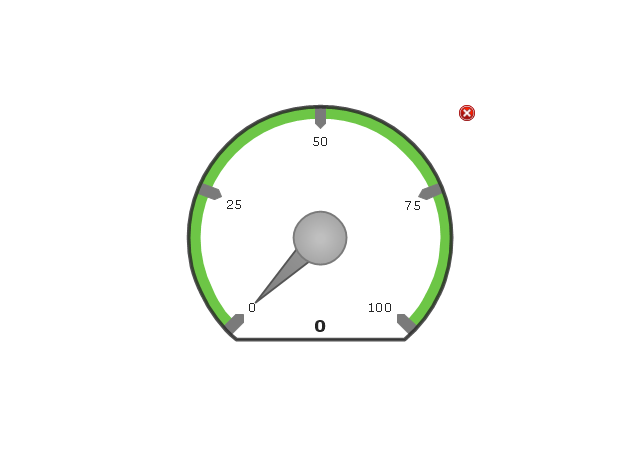
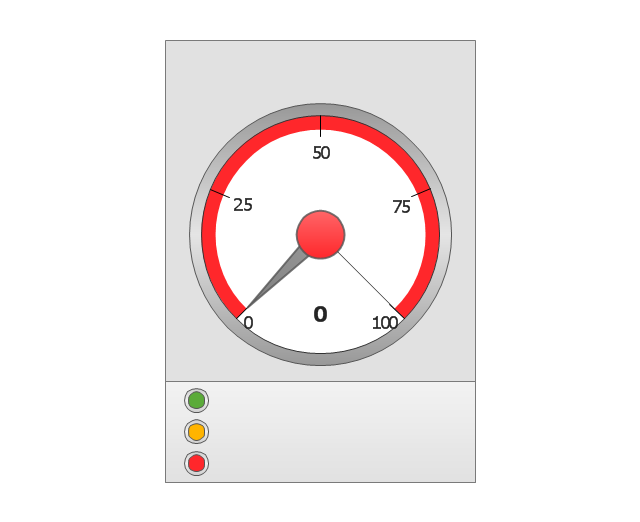
Speedometer Gauge 1

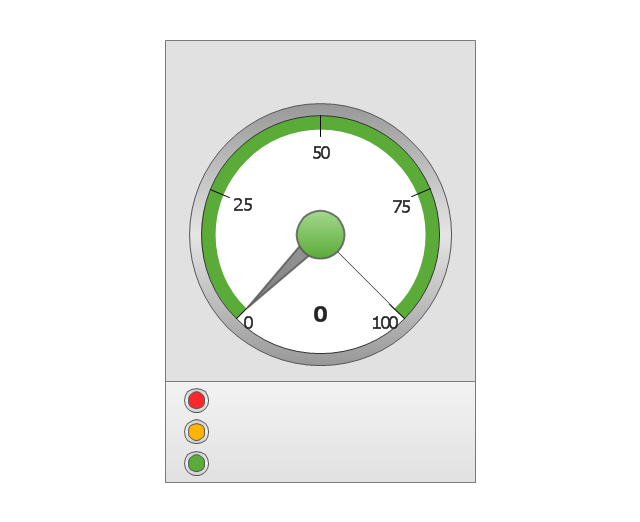
Speedometer Gauge 2
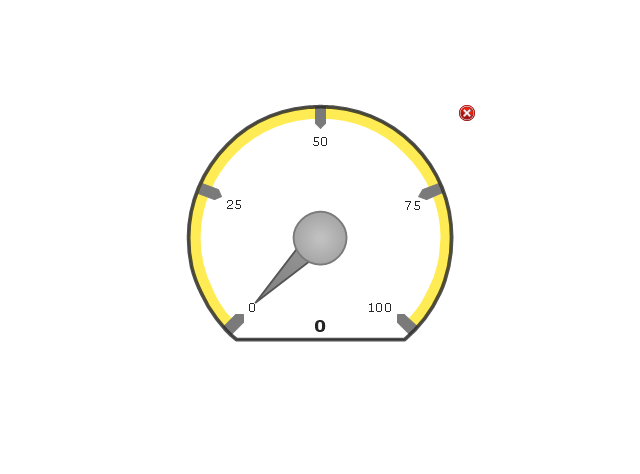
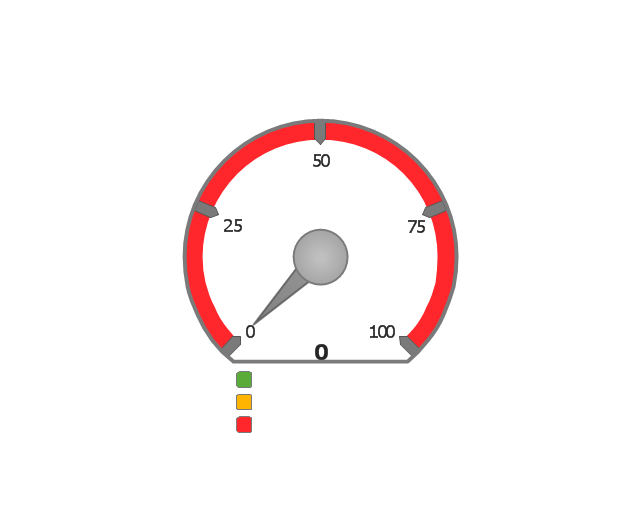
Speedometer Gauge 3
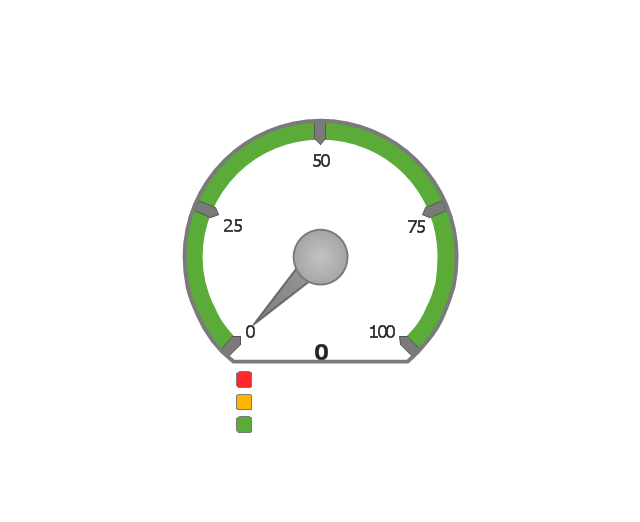
Speedometer Gauge 4
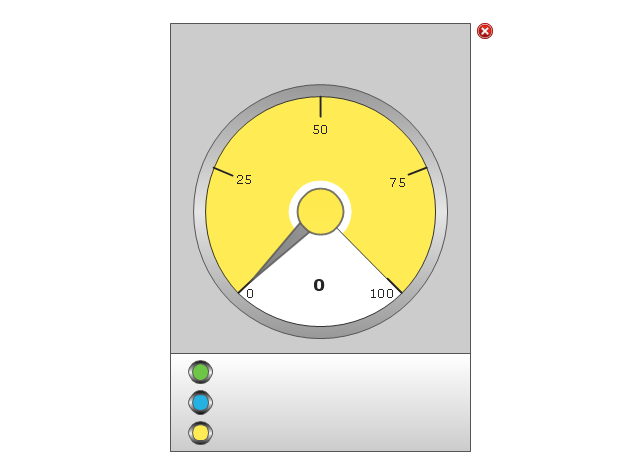
Dial 1
Dial 2
Bullet 1

Bullet 2
Bullet 3
Bullet 4

Bullet 5

Bullet 6

Directed Bullet 1
Directed Bullet 2

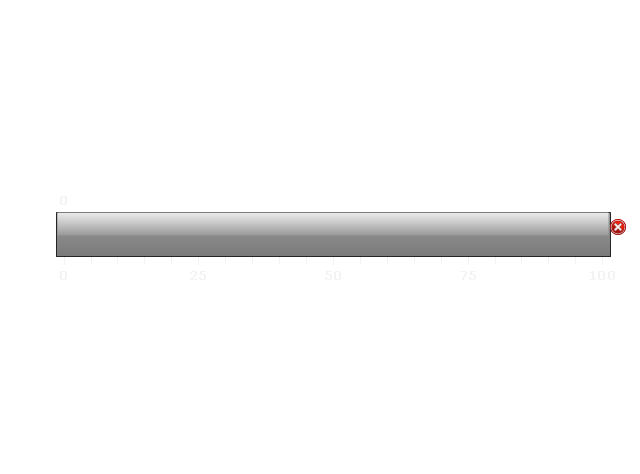
Slider Horizontal 1
Slider Horizontal 2
Slider Horizontal 3
Slider Horizontal 4
Slider Vertical 1
Slider Vertical 2
Slider Horizontal 5
Slider Horizontal 6
Slider Horizontal 7
Slider Vertical 3
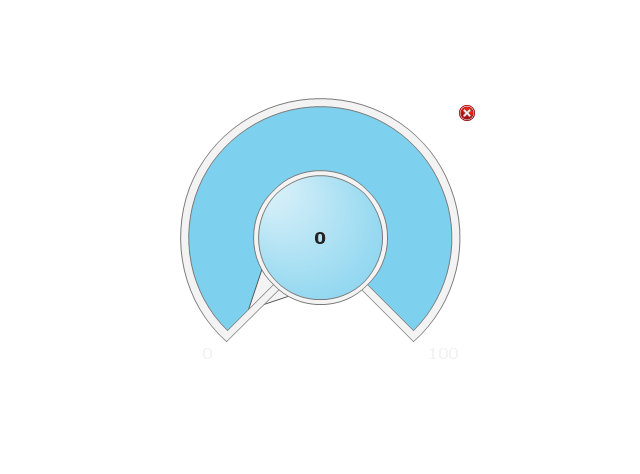
Level Meter 1
Level Meter 2
Level Meter 3
Level Meter 4
Level Meter 5
This sale dashboard example contains KPIs and sales effectiveness metrics visual indicators: speedometer gauge, dial, slider, level meter and bullet indicators.
"Sales effectiveness refers to the ability of a company’s sales professionals to “win” at each stage of the customer’s buying process, and ultimately earn the business on the right terms and in the right timeframe.
Improving sales effectiveness is not just a sales function issue; it’s a company issue, as it requires deep collaboration between sales and marketing to understand what’s working and not working, and continuous improvement of the knowledge, messages, skills, and strategies that sales people apply as they work sales opportunities.
Sales effectiveness has historically been used to describe a category of technologies and consulting services aimed at helping companies improve their sales results.
Many companies are creating sales effectiveness functions and have even given people titles such as VP of Sales Effectiveness." [Sales effectiveness. Wikipedia]
The example "Sales metrics and KPIs" was created using the ConceptDraw PRO diagramming and vector drawing software extended with the Meter Dashboard solution from the area "What is a Dashboard" of ConceptDraw Solution Park.
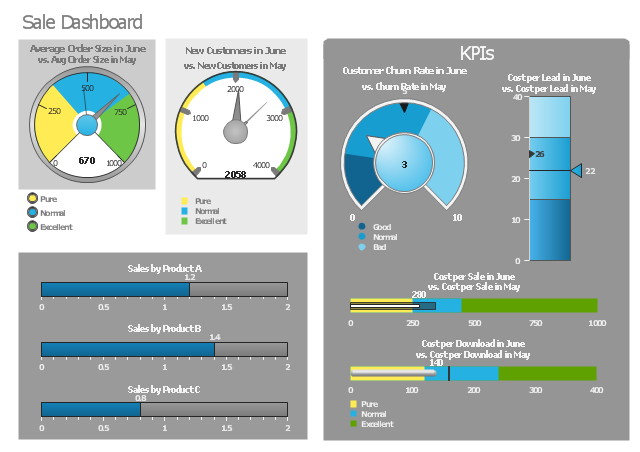
Sales dashboard

The example "Sale dashboard" displays the KPIs and sales effectiveness metrics visual indicators: speedometer gauge, dial, slider, level meter and bullet indicators.
"Sales intelligence (SI) refers to technologies, applications and practices for the collection, integration, analysis, and presentation of information to help salespeople keep up to date with clients, prospect data and drive business. In addition to providing metrics for win-loss and sales confidence, SI can present contextually relevant customer and product information. ...
Top performing companies have implemented sales intelligence programs to improve the quality and quantity of sales leads. SI contextualizes opportunities by providing relevant industry, corporate and personal information. Frequently SI's fact-based information is integrated or includes Customer Relationship Management (CRM).
Although some aspects of sales intelligence overlaps business intelligence (BI), SI is specifically designed for the use of salespeople and sales managers. Unlike customer relationship management (CRM) and traditional business intelligence (BI) applications, SI provides real-time analysis of current sales data and assists with suggesting and delivering actionable, relevant information." [Sales intelligence. Wikipedia]
The example "Sale dashboard" was created using the ConceptDraw PRO diagramming and vector drawing software extended with the Meter Dashboard solution from the area "What is a Dashboard" of ConceptDraw Solution Park.
Sales dashboard
The vector stencils library "Meter indicators" contains 29 Live Objects: speedometer gauge, dial, bullet, slider and level meter visual indicators.
The Live Objects designed to display actual measures of performance metrics from external data source files. Some of them also display comparative measures, and colored zones of qualitative ranges with legend.
Use this library to create visual dashboards in the ConceptDraw PRO diagramming and vector drawing software extended with the Meter Dashboard solution from the area "What is a Dashboard" of ConceptDraw Solution Park.
Speedometer Gauge 1
Speedometer Gauge 2
Speedometer Gauge 3
Speedometer Gauge 4
Dial 1
Dial 2
Bullet 1
Bullet 2

Bullet 3

Bullet 4
Bullet 5

Bullet 6

Directed Bullet 1
Directed Bullet 2

Slider Horizontal 1
Slider Horizontal 2
Slider Horizontal 3
Slider Horizontal 4
Slider Vertical 1
Slider Vertical 2
Slider Horizontal 5
Slider Horizontal 6
Slider Horizontal 7
Slider Vertical 3
Level Meter 1
Level Meter 2
Level Meter 3

Level Meter 4
Level Meter 5
The vector stencils library "Meter indicators 2" contains 29 Live Objects: speedometer gauge, dial, bullet graph, slider and level meter visual indicators.
The Live Objects designed to display actual measures of performance metrics and KPIs from external data source files.
Some of them also display comparative measures, and colored zones of qualitative ranges with legend.
Use it to draw business performance dashboards using the ConceptDraw PRO diagramming and vector drawing software .
"A performance indicator or key performance indicator (KPI) is a type of performance measurement. An organization may use KPIs to evaluate its success, or to evaluate the success of a particular activity in which it is engaged. Sometimes success is defined in terms of making progress toward strategic goals, but often success is simply the repeated, periodic achievement of some level of operational goal. Accordingly, choosing the right KPIs relies upon a good understanding of what is important to the organization. 'What is important' often depends on the department measuring the performance - e.g. the KPIs useful to finance will be quite different from the KPIs assigned to sales. Since there is a need to understand well what is important (to an organization), various techniques to assess the present state of the business, and its key activities, are associated with the selection of performance indicators. These assessments often lead to the identification of potential improvements, so performance indicators are routinely associated with 'performance improvement' initiatives. A very common way to choose KPIs is to apply a management framework such as the balanced scorecard." [Performance indicator. Wikipedia]
The example "Design elements - Meter indicators" is included in the Meter Dashboard solution from the area "What is a Dashboard" of ConceptDraw Solution Park.
Meter indicators
Network Glossary Definition

Easy to draw network topology diagrams, network mapping and Cisco network topology.

 Interactive Voice Response Diagrams
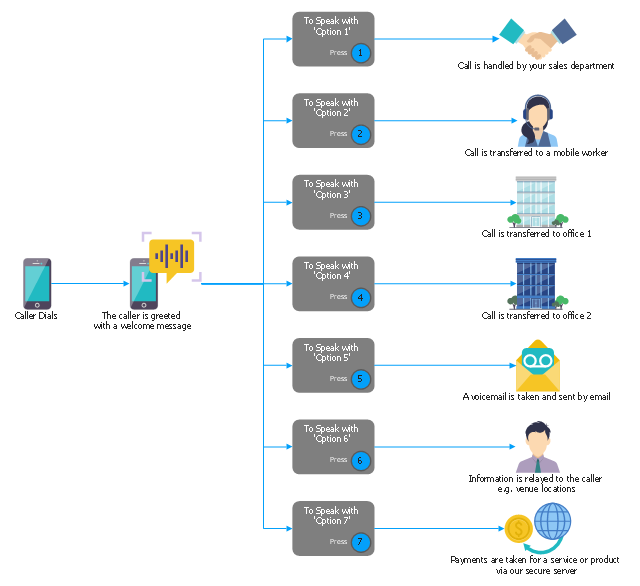
Interactive Voice Response Diagrams solution extends ConceptDraw DIAGRAM software with samples, templates and libraries of ready-to-use vector stencils that help create Interactive Voice Response (IVR) diagrams illustrating in details a work of interactive voice response system, the IVR system’s logical and physical structure, Voice-over-Internet Protocol (VoIP) diagrams, and Action VoIP diagrams with representing voice actions on them, to visualize how the computers interact with callers through voice recognition and dual-tone multi-frequency signaling (DTMF) keypad inputs.
"IVR systems are typically intended to service high call volumes, reduce cost and improve the customer experience. Examples of typical IVR applications are telephone banking, televoting, and credit card services. ...
Voice-Activated Dialing
... (VAD) IVR systems are used to automate routine enquiries to switchboard or PABX (Private Automatic Branch eXchange) operators, and are used in many hospitals and large businesses to reduce the caller waiting time. ...
Entertainment and information.
Some of the largest installed IVR platforms are used for televoting on television game shows, ... which can generate enormous call spikes. Often, the network provider will have to deploy call gapping in the PSTN to prevent network overload. ...
Anonymous access.
IVR systems allow callers to obtain data relatively anonymously. Hospitals and clinics have used IVR systems to allow callers to receive anonymous access to test results. ...
Clinical trials.
IVR systems are used by pharmaceutical companies and contract research organizations to conduct clinical trials and manage the large volumes of data generated. ... Applications include patient randomization and drug supply management. ...
Outbound calling.
IVR systems can be used for outbound calls, as IVR systems are more intelligent than many predictive dialer systems, and can use Call Progress Detection to recognize different line conditions...
Other common IVR services include:
Mobile - Pay-As-You-Go account funding; registration; mobile purchases, such as ring tones and logos;
Banking - balance, payments, transfers, transaction history;
Retail & Entertainment - orders, bookings, credit & debit card payments;
Utilities - meter readings; account look-up, history and balance, payment, consumption history;
Travel — ticket booking, flight information, check-in;
Weather forecasts, water, road and ice conditions" [Interactive voice response. Wikipedia]
The IVR services diagram example was created using the ConceptDraw PRO software extended with the Interactive Voice Response Diagrams solution from the Computer and Networks area of ConceptDraw Solution Park.
IVR services diagram
- Invoice lifecycle | Design elements - Meter indicators | Project tasks ...
- Horizontal Vector Png
- Bullet Point Png
- Text Bullets Png
- 4 Level pyramid model diagram - Information systems types | Design ...
- EPN Frame-Relay and Dial -up Network. Computer and Network ...
- Meter indicators 2 - Vector stencils library
- Phone Logo Png
- Meter indicators 2 - Vector stencils library | Sales dashboard - Vector ...
- Meter indicators - Vector stencils library
- ERD | Entity Relationship Diagrams, ERD Software for Mac and Win
- Flowchart | Basic Flowchart Symbols and Meaning
- Flowchart | Flowchart Design - Symbols, Shapes, Stencils and Icons
- Flowchart | Flow Chart Symbols
- Electrical | Electrical Drawing - Wiring and Circuits Schematics
- Flowchart | Common Flowchart Symbols
- Flowchart | Common Flowchart Symbols