SWOT Analysis

Positioning Map

Daily Schedule Chart

Management Tools — Total Quality Management

IDEF0 Visio

SSADM Diagram

The example below illustrates the waterfall model used in SSADM. This model involves 5 stages of developing a product such as requirements specification and its' analysis, design, coding and testing.
ConceptDraw DIAGRAM Comparison with Omnigraffle Professional and MS Visio

Seven Basic Tools of Quality - Histogram

ConceptDraw DIAGRAM diagramming and vector drawing software offers a powerful Seven Basic Tools of Quality solution from the Quality area of ConceptDraw Solution Park which contains a set of useful tools for easy drawing Histogram and other quality related diagrams of any complexity.
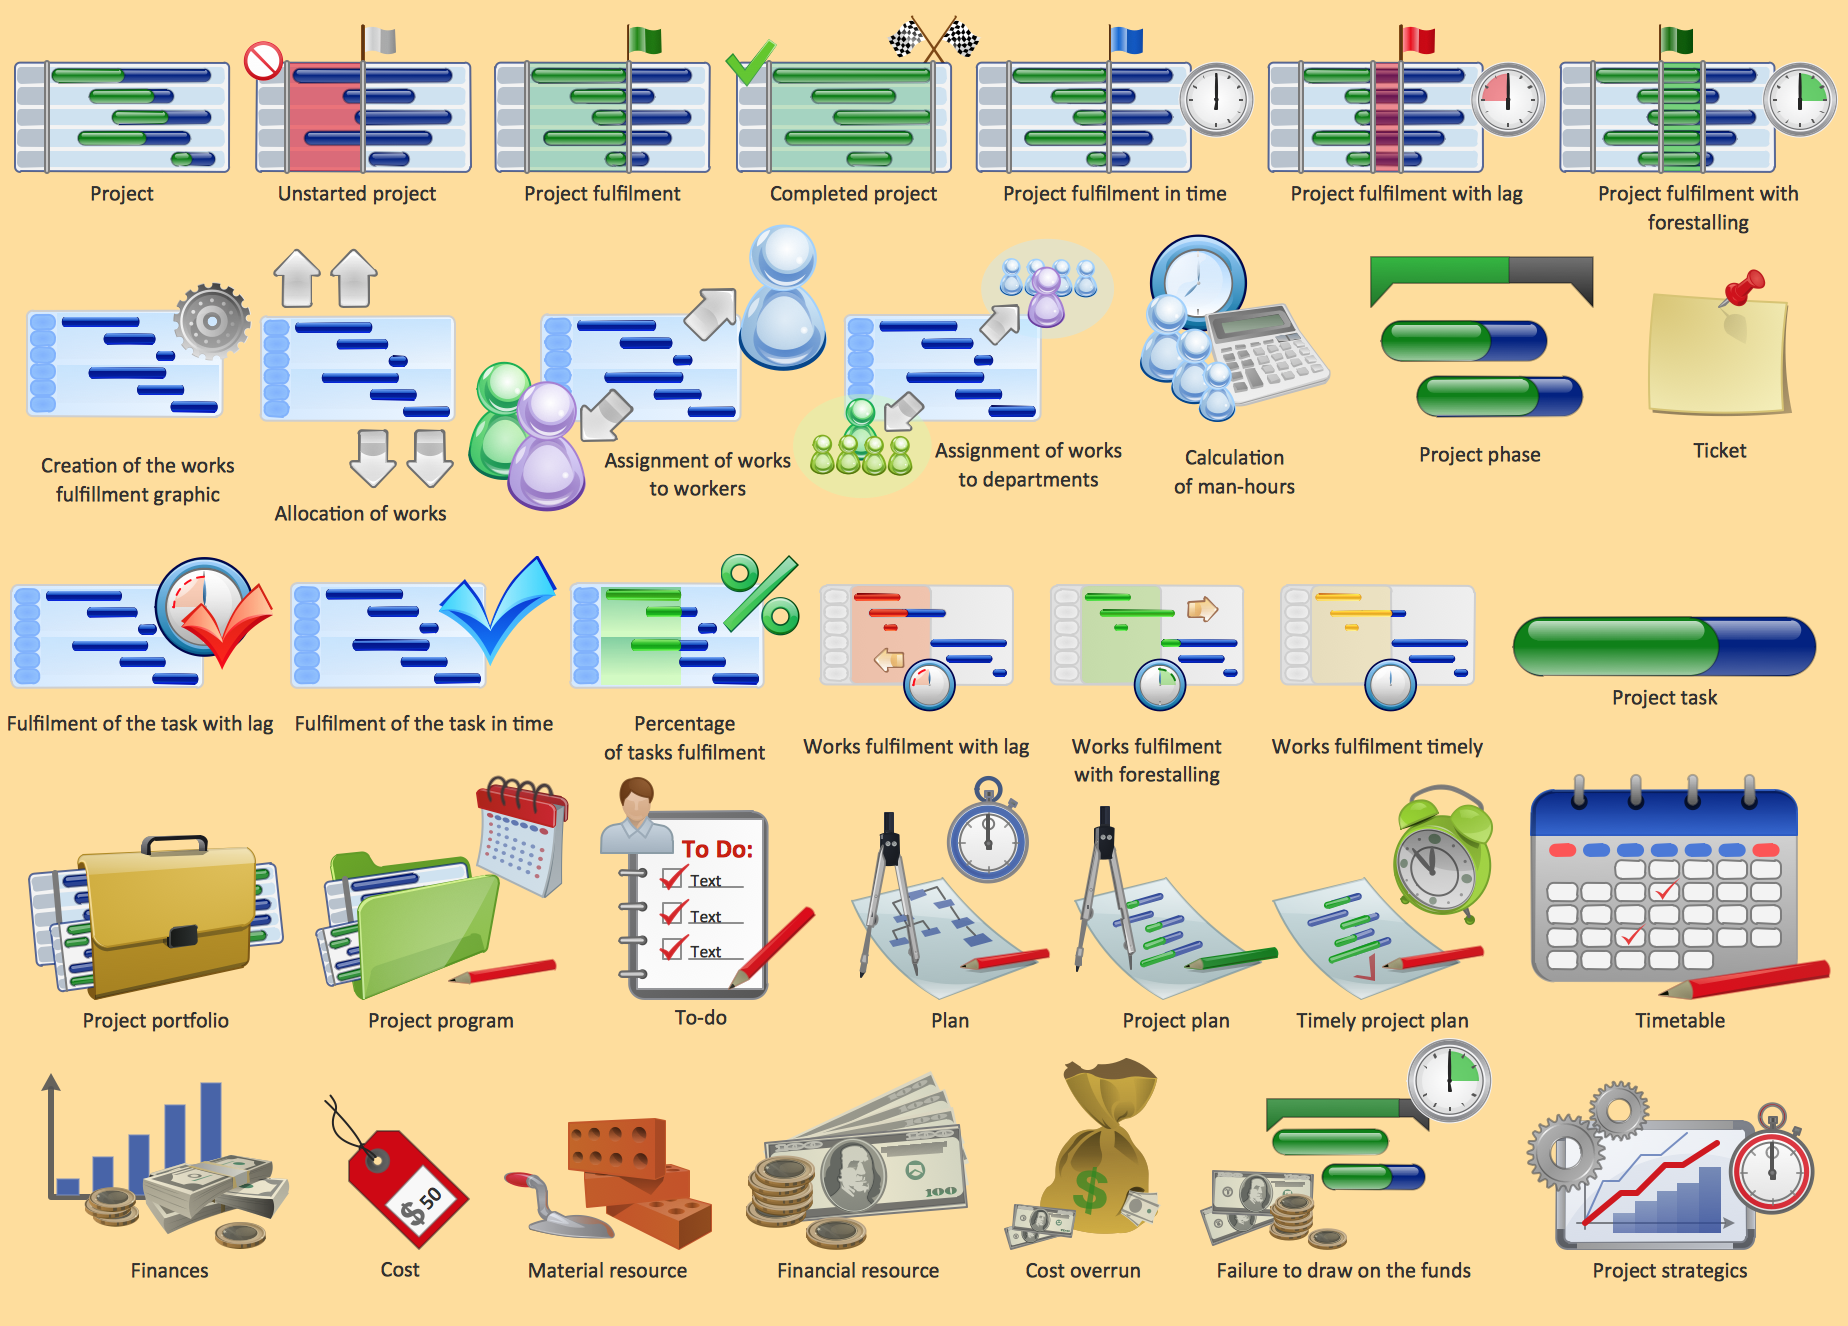
Project management - Design Elements
The Best Tool for Business Process Modeling

Event-Driven Process chain Diagrams for improvement throughout an organisation.
ConceptDraw DIAGRAM - software that reduces the time needed to create a business process model and is great business process improvement tools.
How to Draw EPC Diagram Quickly

An EPC diagram is a complex flowchart that shows different business processes through various workflows. The workflows are seen as functions and events that are connected by different teams or people, as well as tasks that allow business processes to be executed.
ConceptDraw DIAGRAM is a software for making EPC diagrams that allows managers visually present business process models for making decisions for business.

Timeline Diagrams

ConceptDraw DIAGRAM extended with Timeline Diagrams solution from the Management area of ConceptDraw Solution Park is a powerful software for fast and easy drawing useful and great-looking timeline diagrams.
Fishbone Diagram Template

ConceptDraw DIAGRAM diagramming and vector drawing software enhanced with Fishbone Diagrams solution helps you create business productivity diagrams from Fishbone diagram templates and examples, that provide to start using of the graphic method for the analysis of problem causes. Each predesigned Fishbone Diagram template is ready to use and useful for instantly drawing your own Fishbone Diagram.
 Entity-Relationship Diagram (ERD)
An Entity-Relationship Diagram (ERD) is a visual presentation of entities and relationships. That type of diagrams is often used in the semi-structured or unstructured data in databases and information systems. At first glance ERD is similar to a flowch
Stakeholder Onion Diagrams

Design fast and easy Stakeholder Onion Diagrams of any complexity in ConceptDraw DIAGRAM diagramming and vector drawing software using the powerful tools of Stakeholder Onion Diagrams Solution from the Management Area of ConceptDraw Solution Park.
- SWOT Matrix Template | SWOT Analysis | SWOT Analysis Solution ...
- Hiring process workflow | Basic Flowchart Symbols and Meaning ...
- SWOT Matrix Template | SWOT Analysis Software | Digital ...
- Swot Analysis Diagrams Pdf
- How to Create a PowerPoint Presentation from a SWOT Analysis
- Personal Swot Analysis Pdf
- SWOT Matrix Template | SWOT analysis matrix diagram templates ...
- Example Of Matrix Structure Pdf
- Personal Swot Analysis Example Pdf
- Fishbone Analysis Example Pdf
- TOWS analysis matrix - Template
- TOWS analysis matrix - Template | SWOT Analysis Solution ...
- Tows Pdf
- SWOT Analysis Solution - Strategy Tools | TOWS Matrix | How to ...
- Swot Analysis Meaning Full Answer
- Artwork | Process Flow Diagram Symbols Funny Pdf
- Mind Maps for Business - SWOT Analysis | SWOT analysis matrix ...
- How to Create SWOT Analysis Template Using ConceptDraw PRO ...
- SWOT Analysis Solution - Strategy Tools | TOWS Matrix | TOWS ...
- How to Make SWOT Analysis in a Word Document | SWOT analysis ...
- ERD | Entity Relationship Diagrams, ERD Software for Mac and Win
- Flowchart | Basic Flowchart Symbols and Meaning
- Flowchart | Flowchart Design - Symbols, Shapes, Stencils and Icons
- Flowchart | Flow Chart Symbols
- Electrical | Electrical Drawing - Wiring and Circuits Schematics
- Flowchart | Common Flowchart Symbols
- Flowchart | Common Flowchart Symbols