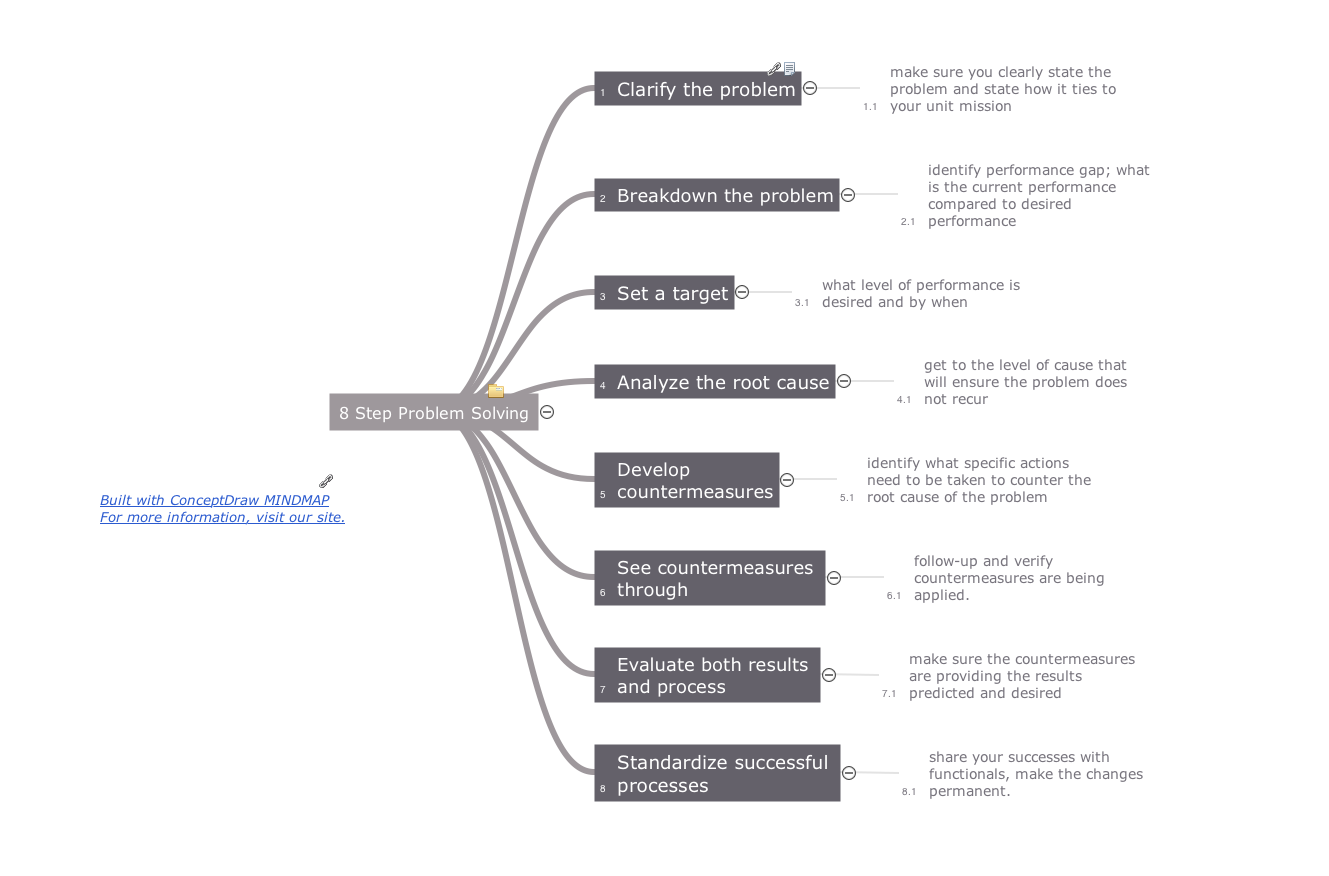
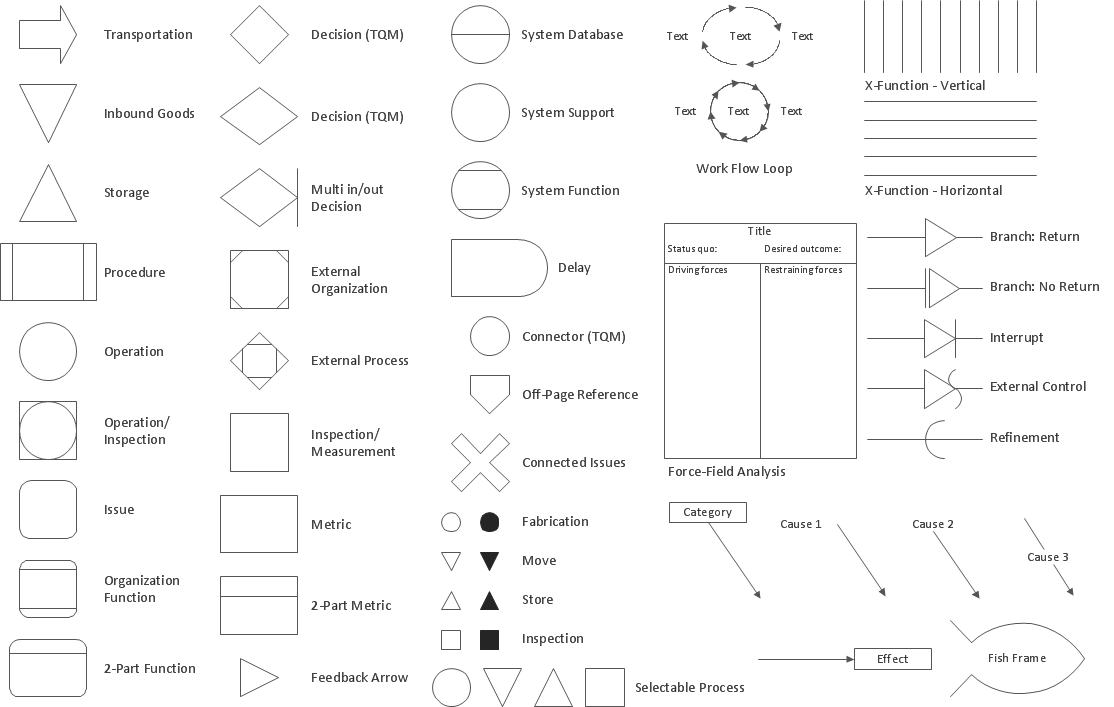
TQM Diagram Tool
The Total Quality Management Diagram solution helps you and your organization visualize business and industrial processes. Create Total Quality Management diagrams for business process with ConceptDraw software.SWOT Analysis Tool for Small Business
SWOT analysis is a method of the making plan to evaluate the Strengths, Weaknesses, Opportunities, and Threats involved in a project. It involves specifying the objective of the project and identifying the internal and external causes for the accomplishing project goals.House of Quality Matrix Software
House of Quality Matrix Software - Use the predesigned objects from the Involvement Matrix Objects Library from the Seven Management and Planning Tools Solution to create professional looking House of Quality Matrices in minutes.Organizational Structure Total Quality Management
The Total Quality Management Diagram solution helps you and your organization visualize business and industrial processes. Create Total Quality Management diagrams for business process with ConceptDraw software.SWOT Analysis Software
SWOT Analysis solution from ConceptDraw Solution Park contains easy-to-use mind map templates that help identify Strengths, Weaknesses, Opportunities, and Threats using ConceptDraw MINDMAP software, as well as outputs to ConceptDraw DIAGRAM for presenting analysis results as SWOT and TOWS matrices.TQM Diagram — Professional Total Quality Management
The Total Quality Management Diagram solution helps you and your organization visualize business and industrial processes. Create Total Quality Management diagrams for business process with ConceptDraw software.Prioritization Matrix
You can design the Prioritization Matrix by hand on the paper, but we offer you the most easier way — to use the ConceptDraw DIAGRAM diagramming and vector drawing software extended with Seven Management and Planning Tools Solution from the Management Area.Helpful in all stages of quality management
ConceptDraw Mind maps can be used to depict a quality process.Total Quality Management Density
The Total Quality Management Diagram solution helps you and your organization visualize business and industrial processes. Create Total Quality Management diagrams for business process with ConceptDraw software.Root Cause Tree Diagram
Analyze the root causes of factors that influence the problem. A diagram is constructed separately for each high priority factor. Identify the root causes for a factor and then propose possible corrective actions. The diagram displays the structure of causes for a factor and possible corrective actions. The Root Cause Analysis Tree Diagram is used for further formulation of actions.- Total Quality Management TQM Diagrams | Matrix Diagram In Tqm
- Prioritisation Matrix In Quality Assurance And Their Examples
- Organogram Software | Authority Matrix Diagram Software ...
- Competitor Analysis | Total Quality Management Value | Matrices ...
- Application Of Matix Diagram In Tqm
- Authority Matrix Diagram Software | PROBLEM ANALYSIS ...
- Competitive feature comparison matrix chart - Digital scouting ...
- Definition TQM Diagram | Total Quality Management TQM Diagrams ...
- Total Quality Management with ConceptDraw | Fishbone Diagrams ...
- Affinity Diagram | Prioritization Matrix | Seven Management and ...
- ERD | Entity Relationship Diagrams, ERD Software for Mac and Win
- Flowchart | Basic Flowchart Symbols and Meaning
- Flowchart | Flowchart Design - Symbols, Shapes, Stencils and Icons
- Flowchart | Flow Chart Symbols
- Electrical | Electrical Drawing - Wiring and Circuits Schematics
- Flowchart | Common Flowchart Symbols