Cause and Effect Analysis


Pyramid Diagram and Pyramid Chart

PROBLEM ANALYSIS. Root Cause Analysis Tree Diagram

ConceptDraw Office suite is a software for problem analysis.
 Stakeholder Onion Diagrams
The Stakeholder Onion Diagram is often used as a way to view the relationships of stakeholders to a project goal. A basic Onion Diagram contains a rich information. It shows significance of stakeholders that will have has influence to the success achieve
 Seven Management and Planning Tools
Seven Management and Planning Tools solution extends ConceptDraw DIAGRAM and ConceptDraw MINDMAP with features, templates, samples and libraries of vector stencils for drawing management mind maps and diagrams.
 Matrices
This solution extends ConceptDraw DIAGRAM software with samples, templates and library of design elements for drawing the business matrix diagrams.
 Management Area
The solutions from Management area of ConceptDraw Solution Park collect templates, samples and libraries of vector stencils for drawing the management diagrams and mind maps.
Total Quality Management Density
 SWOT and TOWS Matrix Diagrams
SWOT and TOWS Matrix Diagrams solution extends ConceptDraw DIAGRAM and ConceptDraw MINDMAP software with features, templates, samples and libraries of vector stencils for drawing SWOT and TOWS analysis matrices and mind maps.
Sales Growth. Bar Graphs Example

 ConceptDraw Solution Park
ConceptDraw Solution Park collects graphic extensions, examples and learning materials
Blank Calendar Template

 Circle-Spoke Diagrams
Examples of subject areas that are well suited to this approach are marketing, business, products promotion, process modeling, market, resource, time, and cost analysis. Circle-Spoke Diagrams are successfully used in presentations, conferences, management documents, magazines, reportages, reviews, reports, TV, and social media.
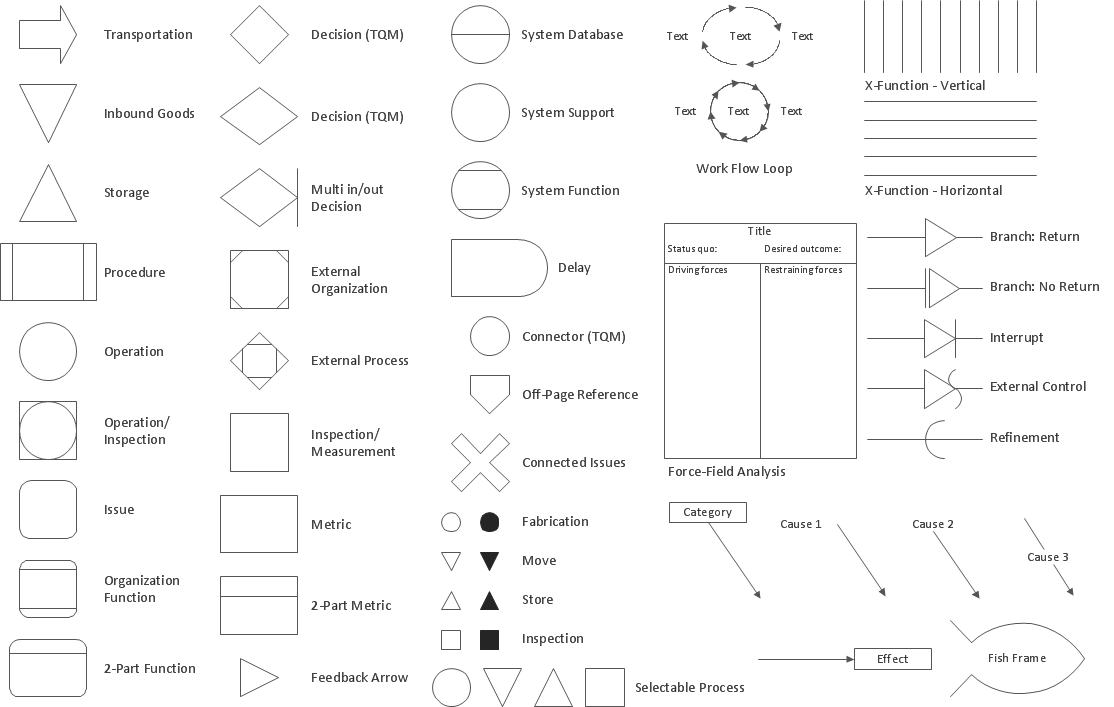
 Logistics Flow Charts
Logistics Flow Charts solution extends ConceptDraw DIAGRAM functionality with opportunities of powerful logistics management software. It provides large collection of predesigned vector logistic symbols, pictograms, objects and clipart to help you design with pleasure Logistics flow chart, Logistics process flow diagram, Inventory flow chart, Warehouse flowchart, Warehouse management flow chart, Inventory control flowchart, or any other Logistics diagram. Use this solution for logistics planning, to reflect logistics activities and processes of an enterprise or firm, to depict the company's supply chains, to demonstrate the ways of enhancing the economic stability on the market, to realize logistics reforms and effective products' promotion.
Flowchart Examples and Templates

- Matrix Diagram For Risk Of Restaurant
- Sample Matrix Diagram Explanation Of A Food Restaurant
- Matrix Diagram For Restaurant
- Matrix Restaurant
- Competitive Analysis Chart Restaurant
- Positioning Map | SWOT analysis positioning matrix - Template ...
- Bar Chart Template for Word | Financial Comparison Chart | How To ...
- Planning Diagram Template
- SWOT Matrix Template | SWOT and TOWS Matrix Diagrams | SWOT ...
- Process Flowchart | Cafe and Restaurant Floor Plans | Stakeholder ...
- How To Create Root Cause Analysis Diagram Using ConceptDraw ...
- How To Create Restaurant Floor Plan in Minutes | How To use ...
- Fault Tree Analysis Diagrams | ConceptDraw Solution Park | Cafe ...
- Activity Network Diagram Method | Restaurant Floor Plans Samples ...
- Office Layout Plans | Cafe and Restaurant Floor Plans | Entity ...
- Flowchart Software | How To Create Restaurant Floor Plan in ...
- TOWS Matrix | Swot Analysis Examples | SWOT Analysis | Example ...
- Family Emergency Plan | Restaurant Floor Plans Samples | Cause ...
- SWOT Analysis | SWOT Matrix | SWOT and TOWS Matrix Diagrams ...
- Production Planning Chart Diagram Of Bench
- ERD | Entity Relationship Diagrams, ERD Software for Mac and Win
- Flowchart | Basic Flowchart Symbols and Meaning
- Flowchart | Flowchart Design - Symbols, Shapes, Stencils and Icons
- Flowchart | Flow Chart Symbols
- Electrical | Electrical Drawing - Wiring and Circuits Schematics
- Flowchart | Common Flowchart Symbols
- Flowchart | Common Flowchart Symbols