Mathematics Symbols

Mathematics solution provides 3 libraries with predesigned vector mathematics symbols and figures:
Solid Geometry Library, Plane Geometry Library and Trigonometric Functions Library.
Mathematical Diagrams

Mathematics solution provides 3 libraries: Plane Geometry Library, Solid Geometry Library, Trigonometric Functions Library.
Basic Flowchart Symbols and Meaning


Physics Symbols

Physics solution provides all tools that you can need for physics diagrams designing. It includes 3 libraries with predesigned vector physics symbols: Optics Library, Mechanics Library and Nuclear Physics Library.
 Mathematics
Mathematics solution extends ConceptDraw PRO software with templates, samples and libraries of vector stencils for drawing the mathematical illustrations, diagrams and charts.
Physics Diagrams

 ConceptDraw Solution Park
ConceptDraw Solution Park collects graphic extensions, examples and learning materials
Types of Flowchart - Overview


UML Notation

Two types of diagrams are used in UML: Structure Diagrams and Behavior Diagrams. Behavior Diagrams represent the processes proceeding in a modeled environment. Structure Diagrams represent the elements that compose the system.
Types of Flowcharts

 Physics
Physics solution extends ConceptDraw PRO software with templates, samples and libraries of vector stencils for drawing the physical illustrations, diagrams and charts.
 Accounting Flowcharts
Accounting Flowcharts solution extends ConceptDraw PRO software with templates, samples and library of vector stencils for drawing the accounting flow charts.
 Flowcharts
The Flowcharts solution for ConceptDraw PRO is a comprehensive set of examples and samples in several varied color themes for professionals that need to represent graphically a process. Solution value is added by the basic flow chart template and shapes' libraries of flowchart notation. ConceptDraw PRO flow chart creator lets one depict the processes of any complexity and length, as well as design the Flowchart either vertically or horizontally.
HelpDesk
How to Draw Geometric Shapes in ConceptDraw PRO

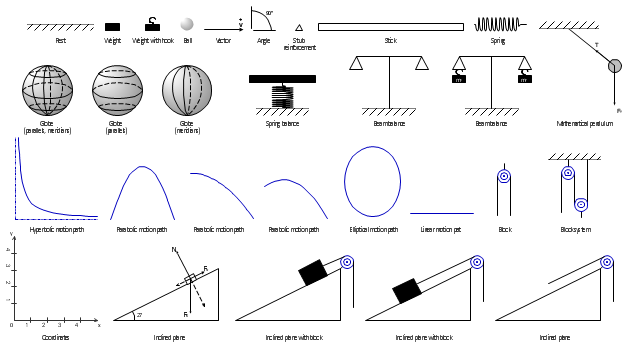
The vector stencils library "Mechanics" contains 29 mechanical symbols.
Use these shapes for drawing mechanics experiment schemes and physical diagrams in the ConceptDraw PRO diagramming and vector drawing software extended with the Physics solution from the Science and Education area of ConceptDraw Solution Park.
www.conceptdraw.com/ solution-park/ science-education-physics
Rest

Co-ordinates
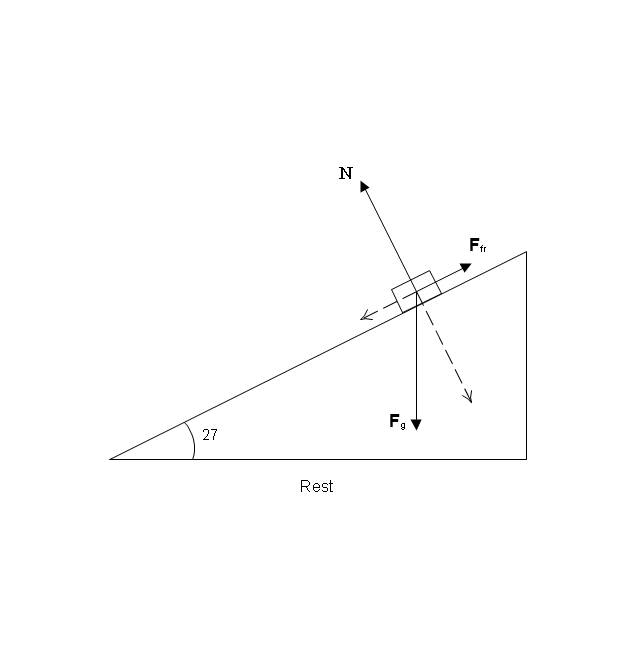
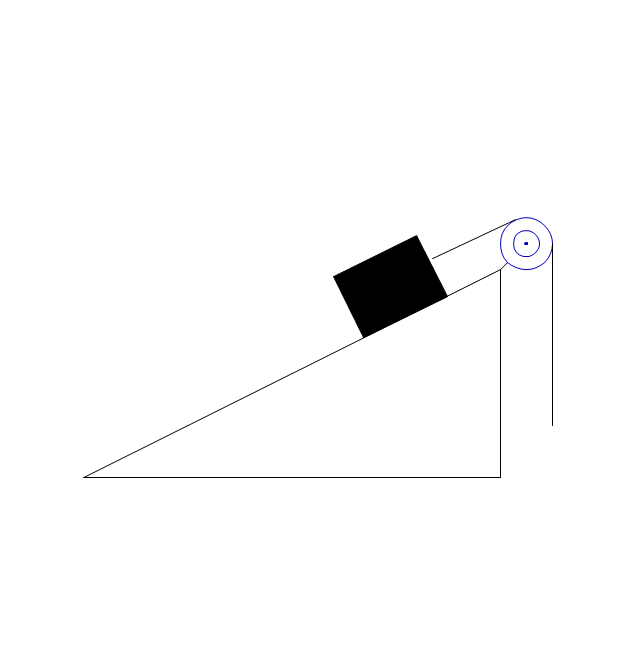
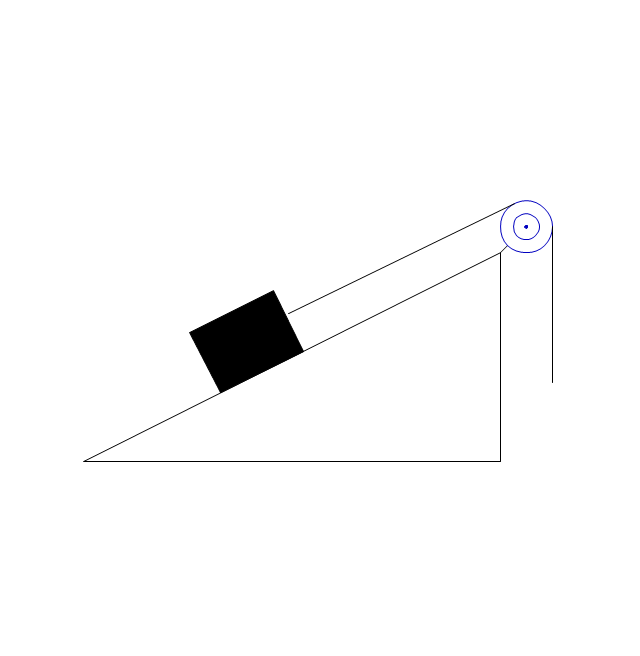
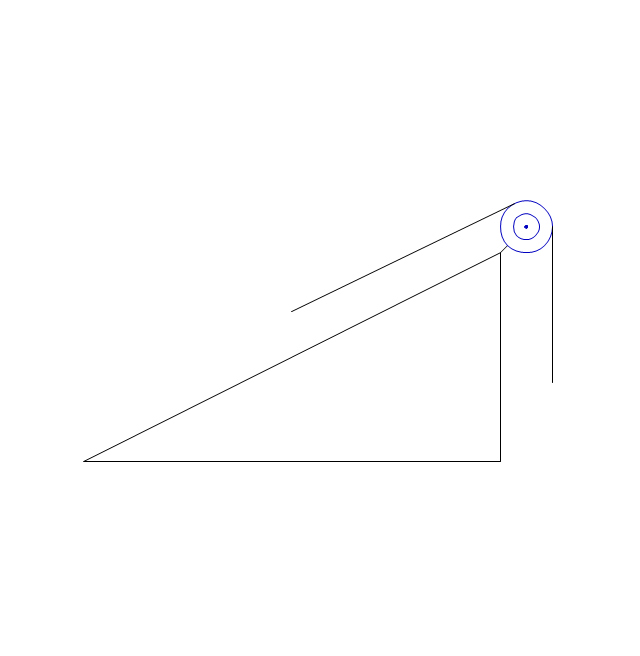
Inclined plane
Block

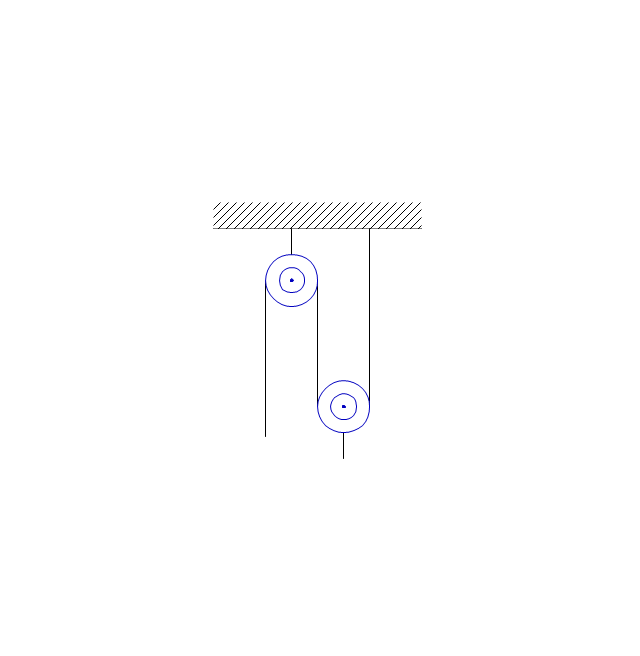
Block System
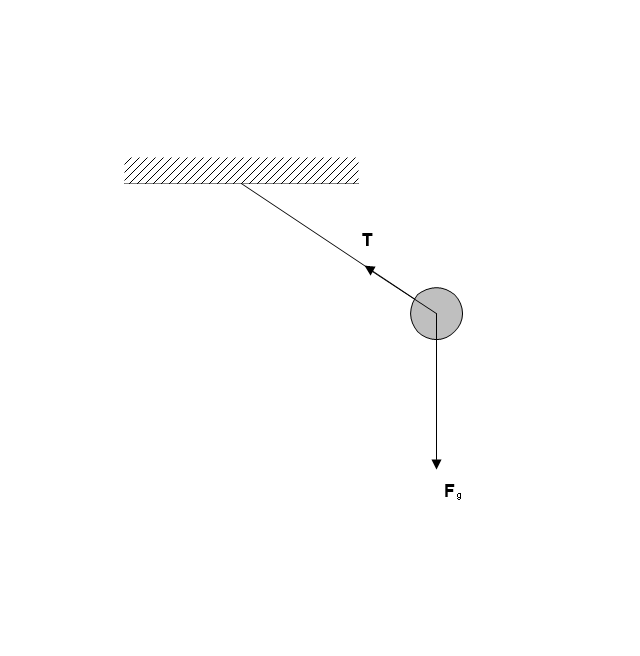
Mathematical pendulum
Inclined plane with block
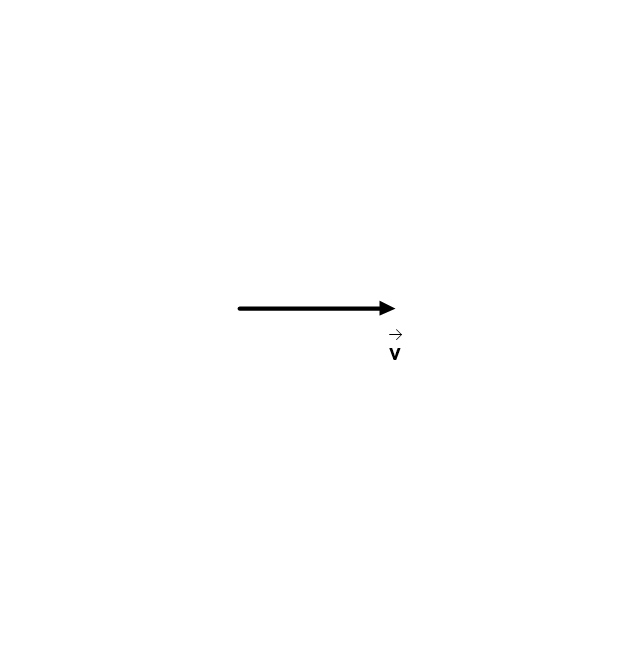
Vector
Parabolic motion path

Parabolic motion path

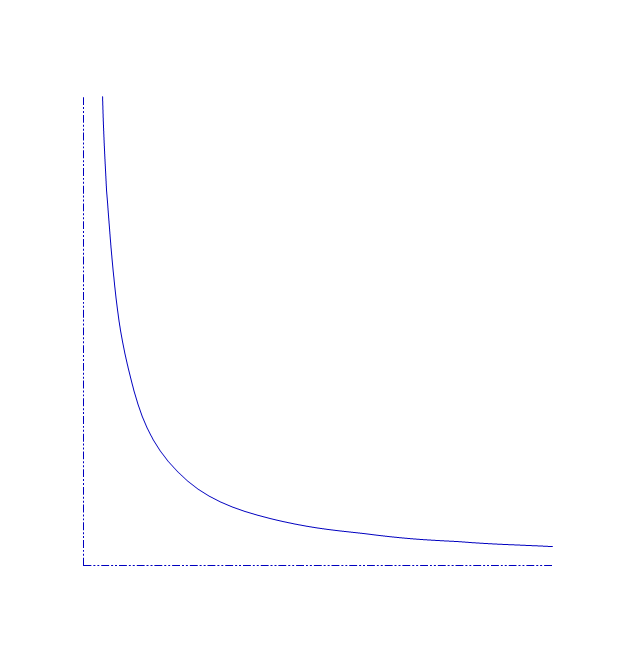
Hyperbolic motion path
Parabolic motion path

Elliptical motion path

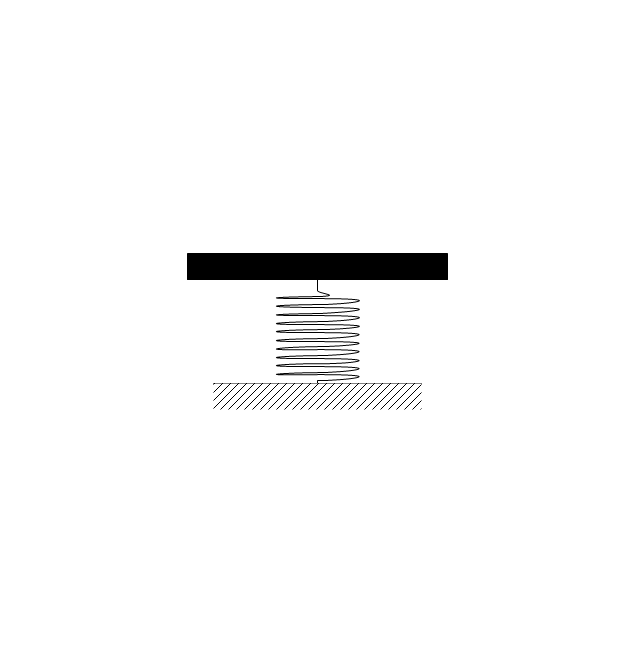
Spring

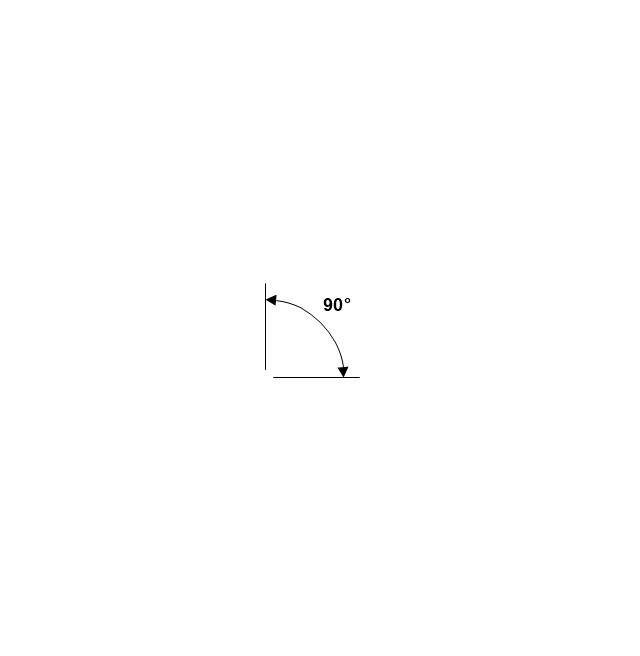
Angle
Linear motion path

Stub Reinforcement

Stick

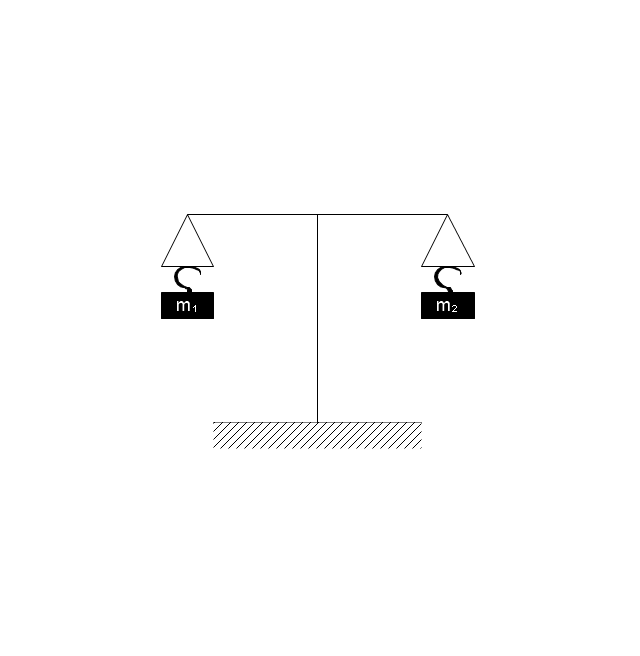
Beam balance

Beam balance 2
Spring Balance
Ball

Weight

Weight, hook

Globe, parallels, meridians

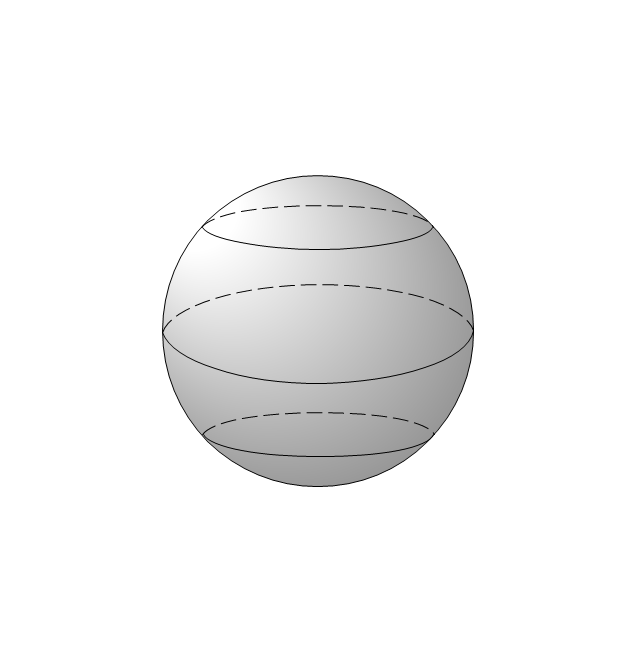
Globe, parallels
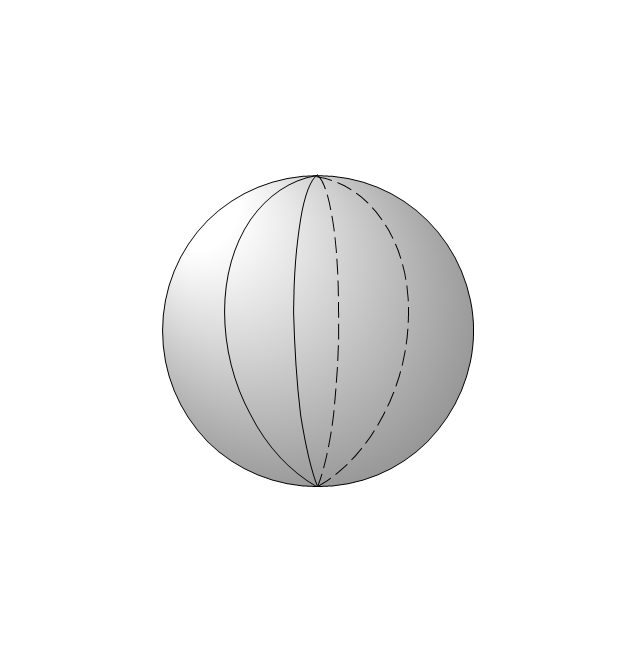
Globe, meridians
Inclined plane with block 2
Inclined plane 2
"The iPhone ... is a line of smartphones designed and marketed by Apple Inc. It runs Apple's iOS mobile operating system. ...
The user interface is built around the device's multi-touch screen, including a virtual keyboard. The iPhone has Wi-Fi and can connect to many different cellular networks, including 1xRTT and GPRS (shown as a circle on the status bar), EDGE (shown as a capital E on the status bar), UMTS and EV-DO (shown as 3G), a faster version of UMTS and 4G (shown as a 4G symbol on the status bar), and LTE (shown as LTE on the status bar). An iPhone can shoot video (though this was not a standard feature until the iPhone 3GS), take photos, play music, send and receive email, browse the web, send texts, GPS navigation, tell jokes, record notes, do mathematical calculations, and receive visual voicemail. Other functions — video games, reference works, social networking, etc. — can be enabled by downloading application programs (‘apps’); as of October 2013, the App Store offered more than one million apps by Apple and third parties." [iPhone. Wikipedia]
The example "iPhone OS (iOS) graphic user interface (GUI) - Standby mode" was created using the ConceptDraw PRO diagramming and vector drawing software extended with the Graphic User Interface solution from the Software Development area of ConceptDraw Solution Park.
iPhone GUI
-graphic-user-interface-(gui)---standby-mode.png--diagram-flowchart-example.png)
The vector stencils library "Mechanics" contains 29 symbol shapes for drawing mechanics experiment schemes and physical diagrams.
"Mechanics ... is the branch of science concerned with the behavior of physical bodies when subjected to forces or displacements, and the subsequent effects of the bodies on their environment. The scientific discipline has its origins in Ancient Greece with the writings of Aristotle and Archimedes. During the early modern period, scientists such as Galileo, Kepler, and especially Newton, laid the foundation for what is now known as classical mechanics. It is a branch of classical physics that deals with particles that are either at rest or are moving with velocities significantly less than the speed of light. It can also be defined as a branch of science which deals with the motion of and forces on objects." [Mechanics. Wikipedia]
The example "Design elements - Mechanics" was created using the ConceptDraw PRO diagramming and vector drawing software extended with the Physics solution from the Science and Education area of ConceptDraw Solution Park.
Mechanical symbols
This work flow chart sample was redesigned from the picture "Weather Forecast" from the article "Simulation Workflows".
[iaas.uni-stuttgart.de/ forschung/ projects/ simtech/ sim-workflows.php]
"(1) The weather is predicted for a particular geological area. Hence, the workflow is fed with a model of the geophysical environment of ground, air and water for a requested area.
(2) Over a specified period of time (e.g. 6 hours) several different variables are measured and observed. Ground stations, ships, airplanes, weather balloons, satellites and buoys measure the air pressure, air/ water temperature, wind velocity, air humidity, vertical temperature profiles, cloud velocity, rain fall, and more.
(3) This data needs to be collected from the different sources and stored for later access.
(4) The collected data is analyzed and transformed into a common format (e.g. Fahrenheit to Celsius scale). The normalized values are used to create the current state of the atmosphere.
(5) Then, a numerical weather forecast is made based on mathematical-physical models (e.g. GFS - Global Forecast System, UKMO - United Kingdom MOdel, GME - global model of Deutscher Wetterdienst). The environmental area needs to be discretized beforehand using grid cells. The physical parameters measured in Step 2 are exposed in 3D space as timely function. This leads to a system of partial differential equations reflecting the physical relations that is solved numerically.
(6) The results of the numerical models are complemented with a statistical interpretation (e.g. with MOS - Model-Output-Statistics). That means the forecast result of the numerical models is compared to statistical weather data. Known forecast failures are corrected.
(7) The numerical post-processing is done with DMO (Direct Model Output): the numerical results are interpolated for specific geological locations.
(8) Additionally, a statistical post-processing step removes failures of measuring devices (e.g. using KALMAN filters).
(9) The statistical interpretation and the numerical results are then observed and interpreted by meteorologists based on their subjective experiences.
(10) Finally, the weather forecast is visualized and presented to interested people." [iaas.uni-stuttgart.de/ forschung/ projects/ simtech/ sim-workflows.php]
The example "Workflow diagram - Weather forecast" was drawn using the ConceptDraw PRO diagramming and vector drawing software extended with the Workflow Diagrams solution from the Business Processes area of ConceptDraw Solution Park.
Work flow chart

- Basic Diagramming | Mathematics Symbols | Mathematical ...
- Education | Mathematics | Mathematics Symbols | Math Vectors Mind ...
- Mathematical Drawing Software
- Software For Drawing Mathematical Diagrams
- Mathematical Diagrams | Basic Diagramming | Mathematics ...
- Types of Flowchart - Overview | Mathematics Symbols | Mathematics ...
- Mathematics | Mathematical Diagrams | Mathematics Symbols ...
- Mathematics | Basic Diagramming | Mathematics Symbols ...
- Mathematics Symbols | Mathematics | Mathematical Diagrams ...
- Mathematics Symbols | Mathematical Diagrams | Mathematics ...
- Mathematical Diagrams | Mathematics Symbols | Math illustrations ...
- Solid geometry - Vector stencils library | Design elements - Solid ...
- Biology | Science and Education Area | Astronomy | Solution Science
- Mathematics | Mathematics Symbols | Mathematical Diagrams ...
- Illustration Software | Biology Illustration | Scientific Symbols Chart ...
- Mathematical Diagrams Software
- Mathematics | Mathematical Diagrams | Scientific Symbols Chart ...
- Mathematical Diagrams | Mathematics Symbols | How to Draw ...
- Design elements - Solid geometry | Scientific Symbols Chart ...
- Design elements - Solid geometry | Mathematics Symbols | Scientific ...
- ERD | Entity Relationship Diagrams, ERD Software for Mac and Win
- Flowchart | Basic Flowchart Symbols and Meaning
- Flowchart | Flowchart Design - Symbols, Shapes, Stencils and Icons
- Flowchart | Flow Chart Symbols
- Electrical | Electrical Drawing - Wiring and Circuits Schematics
- Flowchart | Common Flowchart Symbols
- Flowchart | Common Flowchart Symbols