Bar Diagram Math

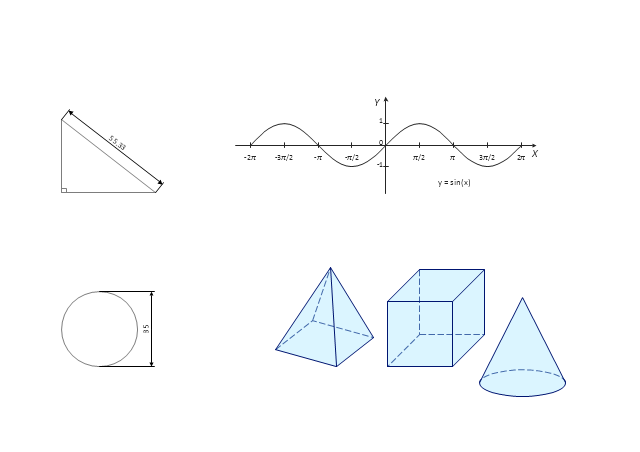
Use this mathematical drawings and graphs template to create your own math illustrations using the shapes of plane and solid geometric figures as well as trigonometric functions.
"Mathematical visualization or mathematical visualization is an aspect of geometry which allows one to understand and explore mathematical phenomena via visualization. Classically this consisted of two-dimensional drawings or building three-dimensional models (particularly plaster models in the 19th and early 20th century), while today it most frequently consists of using computers to make static two or three dimensional drawings, animations, or interactive programs. Writing programs to visualize mathematics is an aspect of computational geometry." [Mathematical visualization. Wikipedia]
The math illustrations template for the ConceptDraw PRO diagramming and vector drawing software is included in the Mathematics solution from the Science and Education area of ConceptDraw Solution Park.
Mathematical drawings and graphs
Basic Diagramming


Types of Flowchart - Overview


 Mathematics
Mathematics solution extends ConceptDraw PRO software with templates, samples and libraries of vector stencils for drawing the mathematical illustrations, diagrams and charts.
Mathematical Diagrams

Mathematics solution provides 3 libraries: Plane Geometry Library, Solid Geometry Library, Trigonometric Functions Library.
HelpDesk
How to Draw Geometric Shapes in ConceptDraw PRO

 Accounting Flowcharts
Accounting Flowcharts solution extends ConceptDraw PRO software with templates, samples and library of vector stencils for drawing the accounting flow charts.
Simple Drawing Applications for Mac

Basic Diagramming Flowchart Software

UML State Machine Diagram.Design Elements

ConceptDraw has 393 vector stencils in the 13 libraries that helps you to start using software for designing your own UML Diagrams. You can use the appropriate stencils of UML notation from UML State Machine library.
 Circular Arrows Diagrams
Circular Arrows Diagrams solution extends ConceptDraw PRO v10 with extensive drawing tools, predesigned samples, Circular flow diagram template for quick start, and a library of ready circular arrow vector stencils for drawing Circular Arrow Diagrams, Segmented Cycle Diagrams, and Circular Flow Diagrams. The elements in this solution help managers, analysts, business advisers, marketing experts, scientists, lecturers, and other knowledge workers in their daily work.
Mathematics Symbols

Mathematics solution provides 3 libraries with predesigned vector mathematics symbols and figures:
Solid Geometry Library, Plane Geometry Library and Trigonometric Functions Library.
The Best Drawing Program for Mac

Best Vector Drawing Application for Mac OS X

 Total Quality Management TQM Diagrams
Total Quality Management Diagrams solution extends ConceptDraw PRO software with samples, templates and vector stencils library for drawing the TQM flowcharts.

Use this template to design your four set Venn diagrams.
In maths logic Venn diagram is "a diagram in which mathematical sets or terms of a categorial statement are represented by overlapping circles within a boundary representing the universal set, so that all possible combinations of the relevant properties are represented by the various distinct areas in the diagram". [thefreedictionary.com/ Venn+diagram]
The template "4-set Venn diagram" for the ConceptDraw PRO diagramming and vector drawing software is included in the Venn Diagrams solution from the area "What is a Diagram" of ConceptDraw Solution Park.
Template

 ConceptDraw Solution Park
ConceptDraw Solution Park collects graphic extensions, examples and learning materials
"In elementary algebra, a quadratic equation (from the Latin quadratus for "square") is any equation having the form
ax^2+bx+c=0
where x represents an unknown, and a, b, and c are constants with a not equal to 0. If a = 0, then the equation is linear, not quadratic. The constants a, b, and c are called, respectively, the quadratic coefficient, the linear coefficient and the constant or free term.
Because the quadratic equation involves only one unknown, it is called "univariate". The quadratic equation only contains powers of x that are non-negative integers, and therefore it is a polynomial equation, and in particular it is a second degree polynomial equation since the greatest power is two.
Quadratic equations can be solved by a process known in American English as factoring and in other varieties of English as factorising, by completing the square, by using the quadratic formula, or by graphing." [Quadratic equation. Wikipedia]
The flowchart example "Solving quadratic equation algorithm" was created using the ConceptDraw PRO diagramming and vector drawing software extended with the Mathematics solution from the Science and Education area of ConceptDraw Solution Park.
Solving quadratic equation flow chart

- Education | Mathematics | Mathematics Symbols | Math Vectors Mind ...
- Basic Diagramming | Education | Mathematics | Mind Map Math
- Math illustrations template | Venn diagrams with ConceptDraw PRO ...
- Math illustration template | Mathematics | Venn diagrams with ...
- Basic Diagramming | Education | The Best Drawing Program for Mac ...
- Basic Diagramming | Mathematics | Education | Concept Draw ...
- Basic Diagramming | Education | Simple Drawing Applications for ...
- Physics Diagrams | Education | Mathematical Diagrams ...
- Bar Diagram Math
- Basic Diagramming | Scientific Symbols Chart | ConceptDraw ...
- Bar Diagram Math | Chart Software for Better Presentations | Divided ...
- Basic Diagramming | Basic Diagramming | Simple Drawing ...
- Education | Basic Diagramming | Mathematics | Mapping Math
- Education | Basic Diagramming | Simple Drawing Applications for ...
- Math Topics Flow Chart Examples
- Pyramid Diagram and Pyramid Chart | Math illustrations - Template ...
- Math illustrations - Template
- Education | Scientific Symbols Chart | Basic Diagramming ...
- Fishbone Diagram Example Of Math
- Bar Diagram Math | Basic Diagramming | Mathematics | Mathematics ...
- ERD | Entity Relationship Diagrams, ERD Software for Mac and Win
- Flowchart | Basic Flowchart Symbols and Meaning
- Flowchart | Flowchart Design - Symbols, Shapes, Stencils and Icons
- Flowchart | Flow Chart Symbols
- Electrical | Electrical Drawing - Wiring and Circuits Schematics
- Flowchart | Common Flowchart Symbols
- Flowchart | Common Flowchart Symbols