Example of DFD for Online Store (Data Flow Diagram)

Example of DFD for Online Store shows the Data Flow Diagram for online store and interactions between the Visitors, Customers and Sellers, as well as Website Information and User databases.

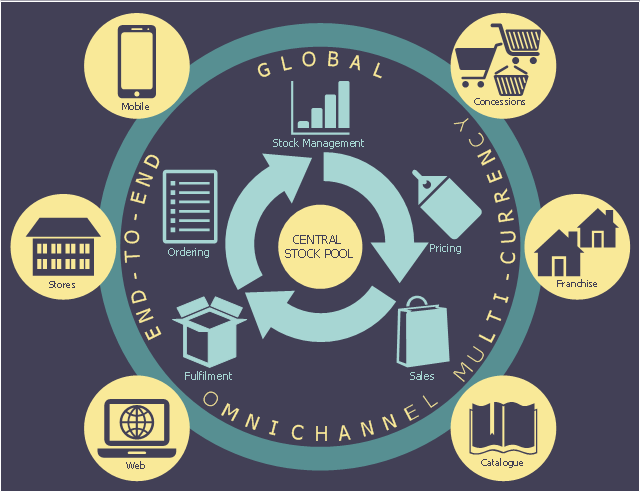
This logistic flow chart sample shows the omnichannel supply chain.
It was designed on the base of the Wikimedia Commons file: Merret-grey.jpeg. [commons.wikimedia.org/ wiki/ File:Merret-grey.jpeg]
This file is licensed under the Creative Commons Attribution-Share Alike 4.0 International license. [creativecommons.org/ licenses/ by-sa/ 4.0/ deed.en]
"An omnichannel supply chain uses a central stock pool to control a number of factors such as pricing, fulfilment, sales, stock management and ordering. These orders are fulfilled from numerous retail channels such as concessions, franchises, catalogue, web, stores and mobile. The central stock pool is the heart of all these operations. The supply chain is now on the front line thanks to omnichannel. Consumers are increasingly demanding in this day and age, expecting to be able to browse, buy and return goods through various channels and not just the traditional in-store way. This requires real-time, channel-agnostic visibility of inventory across the supply chain and a single view of the consumer as they hop from one channel to another." [Omnichannel Supply Chain. Wikipedia]
The logistic flowchart example "Omnichannel supply chain" was created using ConceptDraw PRO diagramming and vector drawing software extended with the Logistics Flow Charts solution from the Business Processes area of ConceptDraw Solution Park.
Logistic flowchart
Business Diagram Software


Flowchart

UML Flowchart Symbols

The Rapid UML solution for ConceptDraw DIAGRAM software offers diversity of UML flowchart symbols for drawing all types of UML diagrams.
Data Flow Diagram Software

ConceptDraw DIAGRAM is a powerful Data Flow Diagram Software thanks to the Data Flow Diagrams solution from the Software Development area of ConceptDraw Solution Park.
You can use the predesigned DFD vector objects that are grouped in 3 libraries of Data Flow Diagrams solution: Data Flow Diagrams Library; Gane-Sarson Notation Library; Yourdon and Coad Notation Library.
Data Flow Diagram Symbols. DFD Library

Sales Process Flowchart. Flowchart Examples

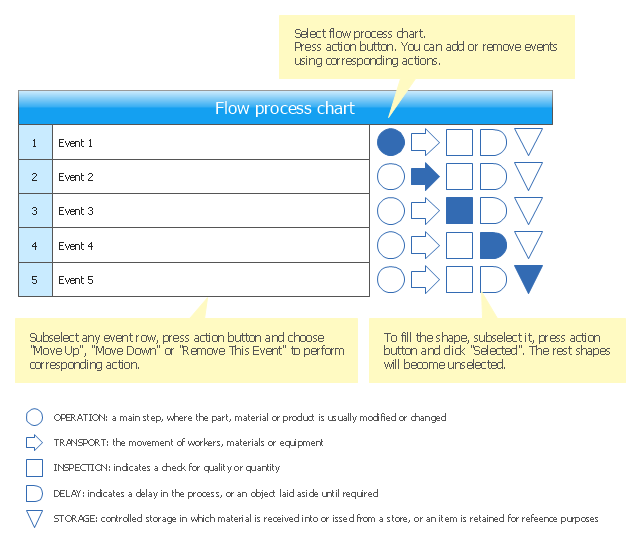
Process chart (flow process chart) visualize the simple process steps along a vertical line as action type symbols with action description. The action types include Operation, Transport, Inspection, Delay and Storage. Process chart are used to find ways of the processes improvement.
The template "Process chart" for the ConceptDraw PRO diagramming and vector drawing software is included in the Matrices solution from the Marketing area of ConceptDraw Solution Park.
The template "Process chart" for the ConceptDraw PRO diagramming and vector drawing software is included in the Matrices solution from the Marketing area of ConceptDraw Solution Park.
Flow process chart template
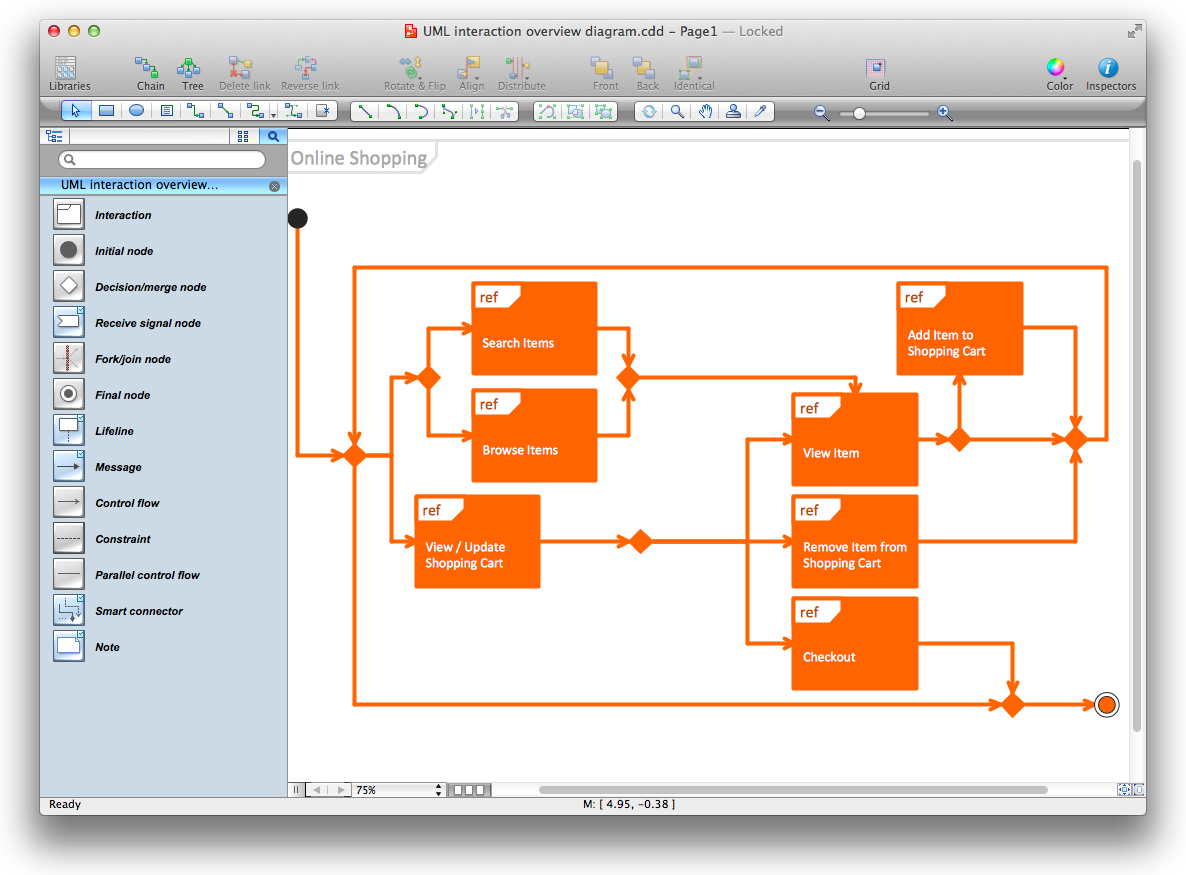
Diagramming Software for Design UML Interaction Overview Diagrams

- Flow chart Example. Warehouse Flowchart | Logistics ...
- Flow Chart For Email Serves
- Packaging, loading, customs - Vector stencils library | Conceptual ...
- Flow chart Example. Warehouse Flowchart | Aerospace and ...
- Value stream mapping - Vector stencils library | Design elements ...
- Top 5 Android Flow Chart Apps | Time picker dialog | Cloud clipart ...
- Packaging, loading, customs - Vector stencils library | Conceptual ...
- Flow Chart Of Booking Car
- US Navy shore establishment - Org chart | Watercraft - Vector ...
- US Navy operating forces - Org chart | US SECNAV - Org chart | US ...
- ERD | Entity Relationship Diagrams, ERD Software for Mac and Win
- Flowchart | Basic Flowchart Symbols and Meaning
- Flowchart | Flowchart Design - Symbols, Shapes, Stencils and Icons
- Flowchart | Flow Chart Symbols
- Electrical | Electrical Drawing - Wiring and Circuits Schematics
- Flowchart | Common Flowchart Symbols
- Flowchart | Common Flowchart Symbols