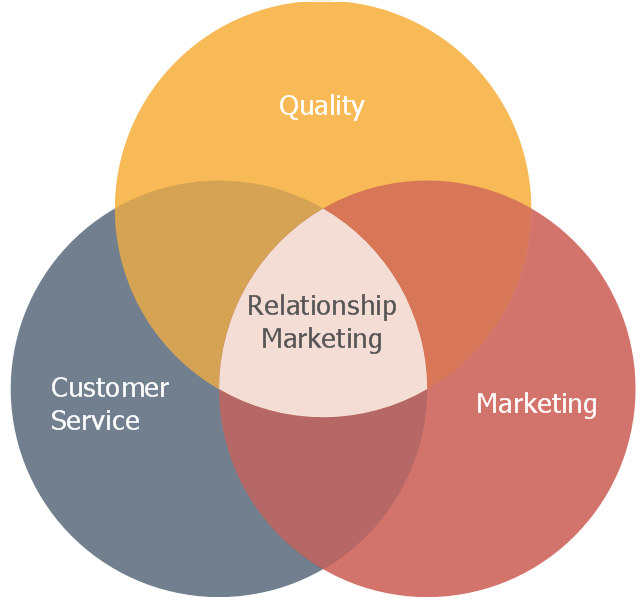
This Venn diagram sample illustrates the relationship marketing.
"Relationship marketing was first defined as a form of marketing developed from direct response marketing campaigns which emphasizes customer retention and satisfaction, rather than a dominant focus on sales transactions.
As a practice, relationship marketing differs from other forms of marketing in that it recognizes the long term value of customer relationships and extends communication beyond intrusive advertising and sales promotional messages.
With the growth of the internet and mobile platforms, relationship marketing has continued to evolve and move forward as technology opens more collaborative and social communication channels. This includes tools for managing relationships with customers that goes beyond simple demographic and customer service data. Relationship marketing extends to include inbound marketing efforts, (a combination of search optimization and strategic content), PR, social media and application development." [Relationship marketing. Wikipedia]
The Venn diagram example "Relationship marketing" was created using the ConceptDraw PRO diagramming and vector drawing software extended with the Venn Diagrams solution from the area "What is a Diagram" of ConceptDraw Solution Park.
Venn diagram
Venn Diagram

 Basic Venn Diagrams
This solution extends ConceptDraw DIAGRAM (or later) with samples, templates, and libraries of vector stencils for drawing Venn Diagrams.
 Venn Diagrams
Venn Diagrams are actively used to illustrate simple set relationships in set theory and probability theory, logic and statistics, mathematics and computer science, linguistics, sociology, and marketing. Venn Diagrams are also often used to visually summarize the status and future viability of a project.
Circles Venn Diagram

This Venn diagram sample shows the relations between Internet marketing professions.
"Online advertising, also called Internet advertising, uses the Internet to deliver promotional marketing messages to consumers. It includes email marketing, search engine marketing, social media marketing, many types of display advertising (including web banner advertising), and mobile advertising. Like other advertising media, online advertising frequently involves both a publisher, who integrates advertisements into its online content, and an advertiser, who provides the advertisements to be displayed on the publisher's content. Other potential participants include advertising agencies who help generate and place the ad copy, an ad server who technologically delivers the ad and tracks statistics, and advertising affiliates who do independent promotional work for the advertiser." [Online advertising. Wikipedia]
The diagram example "Internet marketing professions" was created using the ConceptDraw PRO diagramming and vector drawing software extended with the Venn Diagrams solution from the area "What is a Diagram" of ConceptDraw Solution Park.
Venn diagram

Basic Circles Venn Diagram. Venn Diagram Example

This Venn Diagram shows the relative complement of the set A with respect to the set B. It is the set of the elements in B, but not in A. In other words it is the set-theoretic difference B-A.
3 Circle Venn. Venn Diagram Example

3 Circle Venn Diagram. Venn Diagram Example

Venn Diagrams visualize all possible logical intersections between several sets and are widely used in mathematics, logic, statistics, marketing, sociology, etc.
2 Circle Venn Diagram. Venn Diagram Example

- Venn diagram - Relationship marketing | Cause and Effect Fishbone ...
- Relationship marketing | Venn diagram - Relationship marketing ...
- Relationship marketing | Six Markets Model Chart | Venn Diagram ...
- Internet marketing professions | Basic Venn diagram - Internet ...
- Venn Diagrams | Relationship Marketing Flowchart
- Proximity based marketing | Data Flow Diagrams (DFD) | Venn ...
- Marketing Diagrams | Fire and Emergency Plans | Artwork | Five ...
- Venn diagram - Relationship marketing
- Matrices | Sales Flowcharts | Venn Diagram Of Digital Marketing
- Venn Diagram Examples for Problem Solving. Environmental Social ...
- ERD | Entity Relationship Diagrams, ERD Software for Mac and Win
- Flowchart | Basic Flowchart Symbols and Meaning
- Flowchart | Flowchart Design - Symbols, Shapes, Stencils and Icons
- Flowchart | Flow Chart Symbols
- Electrical | Electrical Drawing - Wiring and Circuits Schematics
- Flowchart | Common Flowchart Symbols
- Flowchart | Common Flowchart Symbols