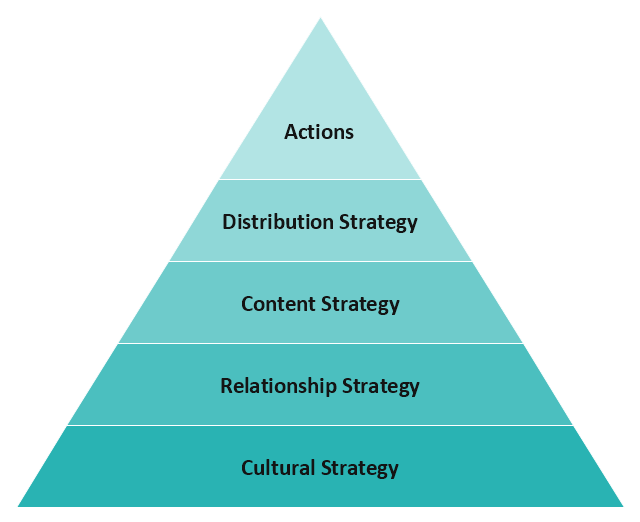
This social strategy pyramid diagram example has 5 levels: Actions, Distribution strategy, Content strategy, Relashionship strategy, Cultural strategy.
"Social marketing seeks to develop and integrate marketing concepts with other approaches to influence behaviors that benefit individuals and communities for the greater social good. It seeks to integrate research, best practice, theory, audience and partnership insight, to inform the delivery of competition sensitive and segmented social change programs that are effective, efficient, equitable and sustainable.
Although "social marketing" is sometimes seen only as using standard commercial marketing practices to achieve non-commercial goals, this is an oversimplification. The primary aim of social marketing is "social good", while in "commercial marketing" the aim is primarily "financial". This does not mean that commercial marketers can not contribute to achievement of social good.
Increasingly, social marketing is being described as having "two parents" - a "social parent", including social science and social policy approaches, and a "marketing parent", including commercial and public sector marketing approaches." [Social marketing. Wikipedia]
This triangular scheme sample "Social strategy" was created using the ConceptDraw PRO diagramming and vector drawing software extended with the Pyramid Diagrams solution from the Marketing area of ConceptDraw Solution Park.
Pyramid diagram
Pyramid Diagram

 Pyramid Diagrams
Pyramid Diagrams solution extends ConceptDraw DIAGRAM software with templates, samples and library of vector stencils for drawing the marketing pyramid diagrams.
Pyramid Charts

A Pyramid Chart has the form of triangle and hierarchically structures, organizes and help to analyze the information, data or ideas. Triangle is divided on the sections that usually have different widths. The width indicates the level of hierarchy among the topics.
Pyramid Diagram and Pyramid Chart

Pyramid Chart Examples

Competitor Analysis

Pyramid Diagram

Marketing Analysis Diagram

Pyramid Diagram

 Marketing
This solution extends ConceptDraw DIAGRAM and ConceptDraw MINDMAP with Marketing Diagrams and Mind Maps (brainstorming, preparing and holding meetings and presentations, sales calls).
Fundraising Pyramid

Pyramid Diagram

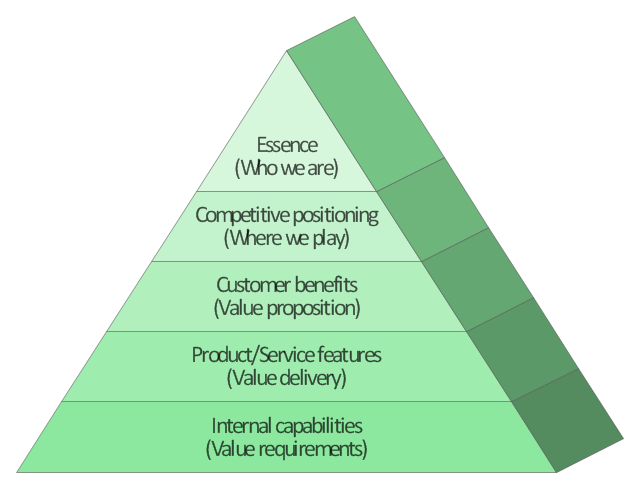
This market value pyramid diagram has 5 levels:
1) Essence (Who we are),
2) Competitive positioning (Where we play),
3) Customer benefits (Value proposition),
4) Product / Service features (Value delivery),
5) Internal capabilitiea (Value requirements).
Use this triangular scheme to develop your marketing strategy.
"Market value or OMV (Open Market Valuation) is the price at which an asset would trade in a competitive auction setting. Market value is often used interchangeably with open market value, fair value or fair market value, although these terms have distinct definitions in different standards, and may differ in some circumstances." [Market value. Wikipedia]
The triangle chart example "Market value" was created using the ConceptDraw PRO diagramming and vector drawing software extended with the Pyramid Diagrams solution from the Marketing area of ConceptDraw Solution Park.
Pyramid diagram
Pyramid Diagram

3D triangular diagram of DIKW pyramid has 6 levels: measurement, facts, data, information, knowledge, wisdom.
The data component include different scattered signs or symbols which are merely useless until these random objective facts are somehow processed. Data is a resource which has to be manipulated or rearranged to get useful. Information can be extracted from a pile of data, it also can be mined from different data storages.
- Marketing Pyramid
- Marketing Pyramid Strategy
- Marketing Analysis Diagram | Competitor Analysis | Social strategy ...
- Pyramid Chart Examples | Social strategy - Pyramid diagram ...
- Brand Marketing Strategy Example
- Marketing Strategy Chart
- Social strategy - Pyramid diagram | Social Media Marketing ...
- Marketing Strategy Diagram
- HVAC Marketing Plan | Block diagram - Six markets model | Pyramid ...
- Hierachy Of Strategy Using Pyramid Model
- Social strategy - Pyramid diagram
- Types Of Marketing Strategy
- Best Diagramming | Social strategy - Pyramid diagram | Marketing ...
- Example Of Strategic Marketing Plan Diagram
- Social strategy - Pyramid diagram | Ice Hockey Diagram – Defensive ...
- Social strategy - Pyramid diagram | Online store social media ...
- Matrices | Marketing Diagrams | Pyramid Diagrams | Diagrams For ...
- Social strategy - Pyramid diagram | How to Draw a Circular Arrows ...
- Pyramid Chart Examples | Competitor Analysis | Growth-Share ...
- Competitor Analysis | Pyramid Chart Examples | Marketing ...
- ERD | Entity Relationship Diagrams, ERD Software for Mac and Win
- Flowchart | Basic Flowchart Symbols and Meaning
- Flowchart | Flowchart Design - Symbols, Shapes, Stencils and Icons
- Flowchart | Flow Chart Symbols
- Electrical | Electrical Drawing - Wiring and Circuits Schematics
- Flowchart | Common Flowchart Symbols
- Flowchart | Common Flowchart Symbols