Marketing Organization Chart

Marketing Flow Chart

Internet Marketing Infographic

HVAC Marketing Plan

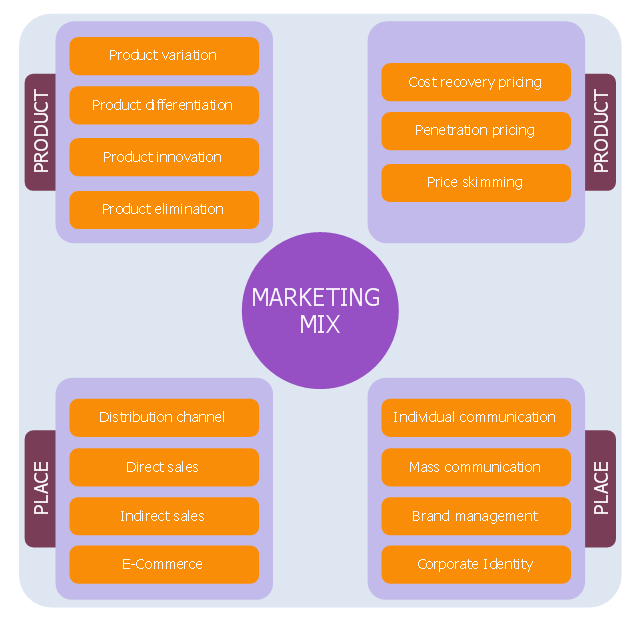
This diagram sample depicts marketing mix. It was designed on the base of the Wikimedia Commons file: Marketing-Mix (en).png.
[commons.wikimedia.org/ wiki/ File:Marketing-Mix_ %28en%29.png]
"The marketing mix is a business tool used in marketing and by marketeers . The marketing mix is often crucial when determining a product or brand's offer, and is often associated with the four P's: price, product, promotion, and place. In service marketing, however, the four Ps are expanded to the seven P's or eight P's to address the different nature of services.
In the 1990s, the concept of four C's was introduced as a more customer-driven replacement of four P's. There are two theories based on four Cs: Lauterborn's four Cs (consumer, cost, communication, convenience), and Shimizu's four Cs (commodity, cost, communication, channel).
In 2012, a new four P's theory was proposed with people, processes, programs, and performance." [Marketing mix. Wikipedia]
The chart example "Marketing mix diagram" was created using the ConceptDraw PRO diagramming and vector drawing software extended with the Marketing Diagrams solution from the Marketing area of ConceptDraw Solution Park.
Chart example
 Marketing Diagrams
Marketing Diagrams solution extends ConceptDraw DIAGRAM diagramming software with abundance of samples, templates and vector design elements intended for easy graphical visualization and drawing different types of Marketing diagrams and graphs, including Branding Strategies Diagram, Five Forces Model Diagram, Decision Tree Diagram, Puzzle Diagram, Step Diagram, Process Chart, Strategy Map, Funnel Diagram, Value Chain Diagram, Ladder of Customer Loyalty Diagram, Leaky Bucket Diagram, Promotional Mix Diagram, Service-Goods Continuum Diagram, Six Markets Model Diagram, Sources of Customer Satisfaction Diagram, etc. Analyze effectively the marketing activity of your company and apply the optimal marketing methods with ConceptDraw DIAGRAM software.
How to Make an Infographic

Fishbone Diagram Example

Fishbone Diagrams solution included to ConceptDraw Solution Park contains powerful drawing tools and a lot of examples, samples and templates. Each Fishbone diagram example is carefully thought-out by experts and is perfect source of inspiration for you.
 Sales Flowcharts
The Sales Flowcharts solution lets you create and display sales process maps, sales process workflows, sales steps, the sales process, and anything else involving sales process management.
Business Process Workflow Diagram

The workflows on the Business Process Workflow Diagram are represented using the set of common symbols which let easy illustrate business processes and process flows, depict the start, all major steps and end of the process, what data are used by the process, how the data flow through the business areas within scope of our project, how the tasks are executed and by who, and how workers interact with each other.

Electrical Symbols — MOSFET

Although the MOSFET is a four-terminal device with source (S), gate (G), drain (D), and body (B) terminals, the body (or substrate) of the MOSFET is often connected to the source terminal, making it a three-terminal device like other field-effect transistors. Because these two terminals are normally connected to each other (short-circuited) internally, only three terminals appear in electrical diagrams. The MOSFET is by far the most common transistor in both digital and analog circuits, though the bipolar junction transistor was at one time much more common.
26 libraries of the Electrical Engineering Solution of ConceptDraw DIAGRAM make your electrical diagramming simple, efficient, and effective. You can simply and quickly drop the ready-to-use objects from libraries into your document to create the electrical diagram.
Cause and Effect Analysis - Fishbone Diagrams for Problem Solving

Electrical Symbols — Transistors

26 libraries of the Electrical Engineering Solution of ConceptDraw DIAGRAM make your electrical diagramming simple, efficient, and effective. You can simply and quickly drop the ready-to-use objects from libraries into your document to create the electrical diagram.
Scatter Graph Charting Software

Scatter Graph

Sales Process Flowchart Symbols

Accounting Cycle Example

ConceptDraw DIAGRAM diagramming and vector drawing software extended with Accounting Flowcharts Solution from the Finance and Accounting Area of ConceptDraw Solution Park offers the extensive drawing tools, library with ready-to-use vector elements which will help you design any accounting cycle example you need.
Create Fishbone Diagrams

To create Fishbone Diagrams, Cause-and-Effect Diagrams, Ishikawa Diagrams, we recommend to use a ConceptDraw DIAGRAM software enhanced with Fishbone Diagrams solution from the Management area of ConceptDraw Solution Park.
2 Circle Venn Diagram. Venn Diagram Example

- Marketing mix - Wheel diagram | Marketing mix diagram | Target ...
- Marketing mix - Wheel diagram | Marketing mix diagram | Circle ...
- Marketing Diagrams | Target and Circular Diagrams | Competitor ...
- Knowledge - Venn diagram | Venn Diagram Examples for Problem ...
- Electrical Symbols — Semiconductor | In searching of alternative to ...
- Daigrams For Marketing Mix
- Service 8 Ps fishbone diagram - Template | Fishbone Diagrams ...
- MOSFET
- Sales Process Flowchart Symbols | Electrical Symbols — MOSFET ...
- Process Flow Diagram Symbols | Electrical Symbols — Analog and ...
- Decision tree diagram | Marketing Diagrams | High level fault tree ...
- Design elements - Marketing indicators | Design elements ...
- Management indicators - Vector stencils library | Design elements ...
- Knowledge - Venn diagram | Knowledge hierarchy triangle diagram ...
- How to Create a Venn Diagram | Venn Diagrams | Multi Layer Venn ...
- News - ConceptDraw
- Design elements - Marketing pictograms | Management indicators ...
- Proton-proton chain reaction diagram | BPR Diagram. Business ...
- Fishbone Diagrams | Fishbone Diagram | Service 8 Ps fishbone ...
- Marketing Charts | Enterprise Architecture Diagrams | Influence ...
- ERD | Entity Relationship Diagrams, ERD Software for Mac and Win
- Flowchart | Basic Flowchart Symbols and Meaning
- Flowchart | Flowchart Design - Symbols, Shapes, Stencils and Icons
- Flowchart | Flow Chart Symbols
- Electrical | Electrical Drawing - Wiring and Circuits Schematics
- Flowchart | Common Flowchart Symbols
- Flowchart | Common Flowchart Symbols