HelpDesk
How to Draw a Circular Arrows Diagram Using ConceptDraw PRO

 ConceptDraw Solution Park
ConceptDraw Solution Park collects graphic extensions, examples and learning materials
 Marketing Diagrams
This solution extends ConceptDraw PRO with samples, templates and library of design elements for drawing the marketing diagrams.
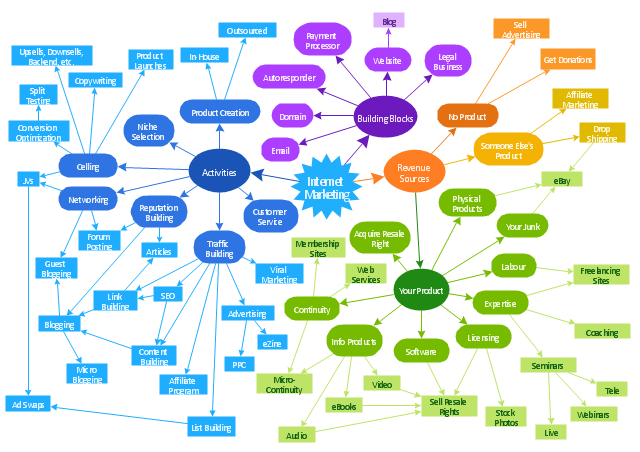
"Online advertising, also called Internet advertising, uses the Internet to deliver promotional marketing messages to consumers. It includes email marketing, search engine marketing, social media marketing, many types of display advertising (including web banner advertising), and mobile advertising. Like other advertising media, online advertising frequently involves both a publisher, who integrates advertisements into its online content, and an advertiser, who provides the advertisements to be displayed on the publisher's content. Other potential participants include advertising agencies who help generate and place the ad copy, an ad server who technologically delivers the ad and tracks statistics, and advertising affiliates who do independent promotional work for the advertiser." [Online advertising. Wikipedia]
The concept map example "Internet marketing" was created using the ConceptDraw PRO diagramming and vector drawing software extended with the Concept Maps solution from the area "What is a Diagram" of ConceptDraw Solution Park.
The concept map example "Internet marketing" was created using the ConceptDraw PRO diagramming and vector drawing software extended with the Concept Maps solution from the area "What is a Diagram" of ConceptDraw Solution Park.
Concept map
Flowchart Marketing Process. Flowchart Examples

Using the ready-to-use predesigned objects, samples and templates from the Flowcharts Solution for ConceptDraw PRO you can create your own professional looking Flowchart Diagrams quick and easy.
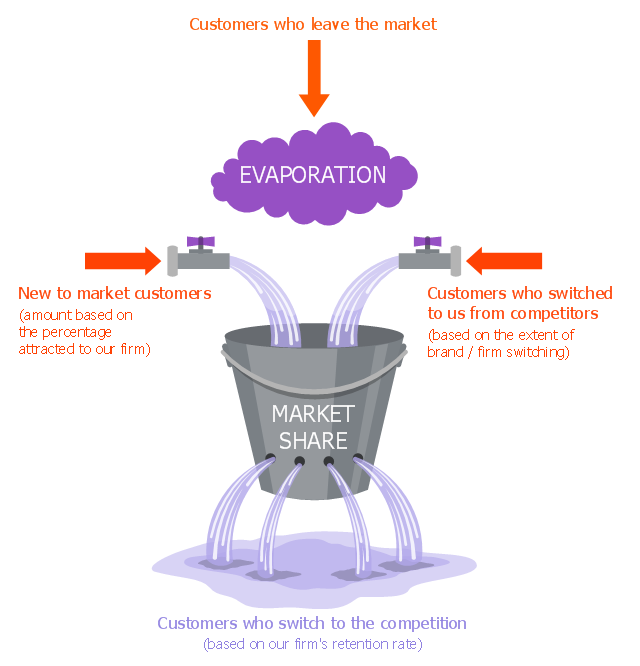
"The leaky bucket theory The leaky bucket theory is the model that seeks to describe the process of customer gain and loss, otherwise known as customer churn . Customer retention is one of the key concepts in relationship marketing. Most companies concentrate on recruiting new customers to replace customers who move on, rather than seeking to retain customers." [Blythe J. Key Concepts in Marketing. 2009. knowledge.sagepub.com/ view/ key-concepts-in-marketing/ n5.xml]
"Customer attrition, also known as customer churn, customer turnover, or customer defection, is the loss of clients or customers.
Banks, telephone service companies, Internet service providers, pay TV companies, insurance firms, and alarm monitoring services, often use customer attrition analysis and customer attrition rates as one of their key business metrics (along with cash flow, EBITDA, etc.) because the "...cost of retaining an existing customer is far less than acquiring a new one." Companies from these sectors often have customer service branches which attempt to win back defecting clients, because recovered long-term customers can be worth much more to a company than newly recruited clients." [Customer attrition. Wikipedia]
The example "Leaky bucket diagram" was created using the ConceptDraw PRO diagramming and vector drawing software extended with the Marketing Diagrams solution from the Marketing area of ConceptDraw Solution Park.
Leaky bucket diagram
 Venn Diagrams
Venn Diagrams are actively used to illustrate simple set relationships in set theory and probability theory, logic and statistics, mathematics and computer science, linguistics, sociology, and marketing. Venn Diagrams are also often used to visually summarize the status and future viability of a project.
Pyramid Diagram

 Target and Circular Diagrams
This solution extends ConceptDraw PRO software with samples, templates and library of design elements for drawing the Target and Circular Diagrams.
Pyramid Diagram

 Event-driven Process Chain Diagrams
Event-driven Process Chain (EPC) Diagram is a type of flowchart widely used for modeling in business engineering and reengineering, business process improvement, and analysis. EPC method was developed within the Architecture of Integrated Information Systems (ARIS) framework.
Concept Maps

ConceptDraw PRO diagramming and vector drawing software extended with Concept Maps Solution from the "What is a Diagram" Area is effective tool for creating professional looking Concept Maps.
 Circle-Spoke Diagrams
Examples of subject areas that are well suited to this approach are marketing, business, products promotion, process modeling, market, resource, time, and cost analysis. Circle-Spoke Diagrams are successfully used in presentations, conferences, management documents, magazines, reportages, reviews, reports, TV, and social media.
 Matrices
This solution extends ConceptDraw PRO software with samples, templates and library of design elements for drawing the business matrix diagrams.
 AWS Architecture Diagrams
The flexible AWS cloud solutions will help you to create reliable applications with a high level of scaling in the AWS cloud, to run your applications and accelerate their work on the level of security. Besides AWS resources are available worldwide and yo
- Societal Marketing Concept Diagram
- Diagram Marketing Concept
- Internet Marketing Infographic | Internet marketing - Concept map ...
- Internet marketing - Concept map | Flowchart Marketing Process ...
- Examples Of Marketing Concept
- Concept Map Of Marketing
- Internet marketing - Concept map | Marketing - Vector stencils library ...
- Internet marketing - Concept map | Venn diagram - Internet ...
- Marketing Diagrams | Marketing plan - Circular diagram | Internet ...
- Internet marketing - Concept map | Concept Maps | What Is a ...
- Concept Of Marketing With Diagram
- Marketing | ConceptDraw Solution Park | Venn Diagrams | Illustrate ...
- Internet marketing - Concept map | What Is a Concept Map | Concept ...
- Flowchart Marketing Process. Flowchart Examples | Concept Maps ...
- Marketing - Vector stencils library | Internet marketing - Concept map ...
- Concept Maps | Concept Map Maker | Team psychological ...
- Internet marketing - Concept map | Marketing | Design elements ...
- Concept Of Product Market With Diagram
- Social strategy - Pyramid diagram | Online store social media ...
- The Circle Of Market Concepts
- ERD | Entity Relationship Diagrams, ERD Software for Mac and Win
- Flowchart | Basic Flowchart Symbols and Meaning
- Flowchart | Flowchart Design - Symbols, Shapes, Stencils and Icons
- Flowchart | Flow Chart Symbols
- Electrical | Electrical Drawing - Wiring and Circuits Schematics
- Flowchart | Common Flowchart Symbols
- Flowchart | Common Flowchart Symbols