This site uses cookies. By continuing to browse the ConceptDraw site you are agreeing to our Use of Site Cookies.

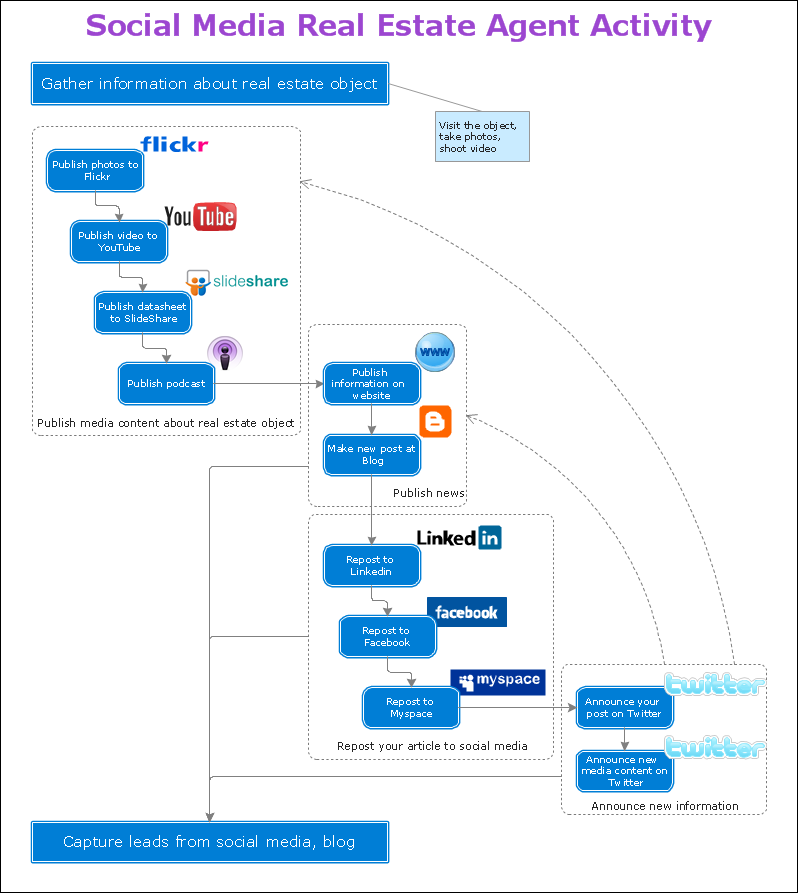
How to Connect Social Media DFD Flowchart with Action Maps

The Social Media Response solution creates interactive social media flow charts and action mind maps. The solution includes a video tutorial and a number of samples helping social media teams refine and organize their response process.

Entity-Relationship Diagram (ERD) with ConceptDraw DIAGRAM

Entity-Relationship Diagram (ERD) serves for detailed description of structures and databases. An ERD represents a diagram made up mainly of rectangular blocks (for entities, or data) linked with relationships. The links between the blocks describe relations between these entities. There are three types of relationships: one-to-one,
one-to-many, many-to-many.
Draw Entity-Relationship Diagrams (ERD) easily with ConceptDraw extended with Entity-Relationship Diagram (ERD) Solution from the Software Development Area. Use ERD software to create ER diagram.
How to Build an Entity Relationship Diagram (ERD)

How To Create Project Report

ConceptDraw PROJECT contains an extensive tool set to help project managers. The rich data visualization capability that is provided by ConceptDraw products helps you create project dashboards, one-click reports, multi-project views, Gantt charts, and resource views. Let′s learn how to get maximum value using ConceptDraw PROJECT!

UML Use Case Diagram Example. Social Networking Sites Project

UML Diagrams Social Networking Sites Project. This sample was created in ConceptDraw DIAGRAM diagramming and vector drawing software using the UML Use Case Diagram library of the Rapid UML Solution from the Software Development area of ConceptDraw Solution Park.
This sample shows the Facebook Socio-health system and is used at the projection and creating of the social networking sites.

SWOT Matrix Template

A SWOT analysis can be carried out for a product, place, industry or person. It involves specifying the objective of the business venture or project and identifying the internal and external factors that are favorable and unfavorable to achieving that objective.

Organizing and Selecting Social Media Response Action

Interactive tool helps you find the appropriate response to social media mentions quickly.

SWOT analysis Software & Template for Macintosh and Windows

The ConceptDraw is a SWOT analysis software developed for Macintosh and Windows OS.

BCG Matrix

The growth–share matrix (BCG Matrix) was created by Bruce D. Henderson for the Boston Consulting Group in 1970 to help corporations to analyze their business units and to help the company allocate resources. How is it easy design the BCG Matrices in ConceptDraw DIAGRAM diagramming and vector drawing software supplied with unique Matrices Solution from the Marketing Area of ConceptDraw Solution Park.

SWOT analysis matrix diagram templates

Every day each company has challenge how to win the rally with competors. How to determine a path to the successful business? The one of best methodologies is SWOT Analysis. Abbreviation SWOT definition: S = strengths, W = weaknesses, O = opportunities, T = threats. Often named SWOT Matrix was introduced first at 1960s as examining tool of internal capabilities and possibilities of big companies. The SWOT analysis aim is to find critical factors influenced to company's business goal. You can begin a strategy to distinguish better competition value and to become successful in your market. Achiving best results form SWOT analysis can be reached when several employees will be involved at the process. Management, sales and customer service can all offer reasonable comprehension competitive situation.

UML Diagram for Mac

This sample was created on the Mac in ConceptDraw DIAGRAM diagramming and vector drawing software using the UML State Machine Diagram library of the Rapid UML Solution from the Software Development area of ConceptDraw Solution Park.