This site uses cookies. By continuing to browse the ConceptDraw site you are agreeing to our Use of Site Cookies.
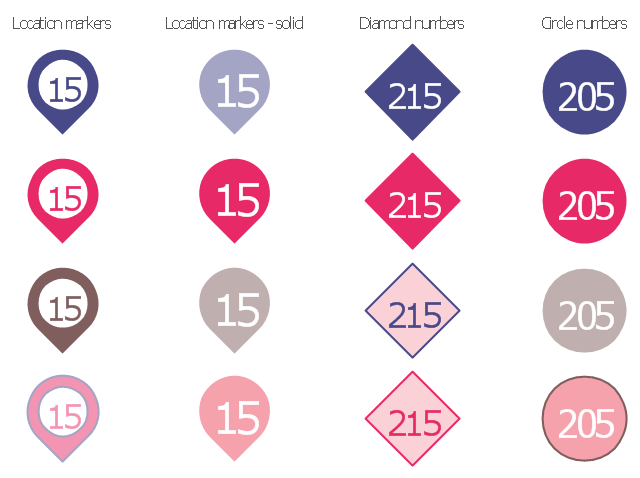
The vector stencils library "Numbers" contains 16 number blocks: location marker, diamond and circle shapes. Use it to add typography elements into your infographics.
The example "Design elements - Numbers" was created using the ConceptDraw PRO diagramming and vector drawing software extended with the Typography Infographics solition from the area "What is infographics" in ConceptDraw Solution Park.
Typography infographics elements - Number blocks
Typography infographics elements - Number blocks, numbers, location marker, numbers,
HelpDesk

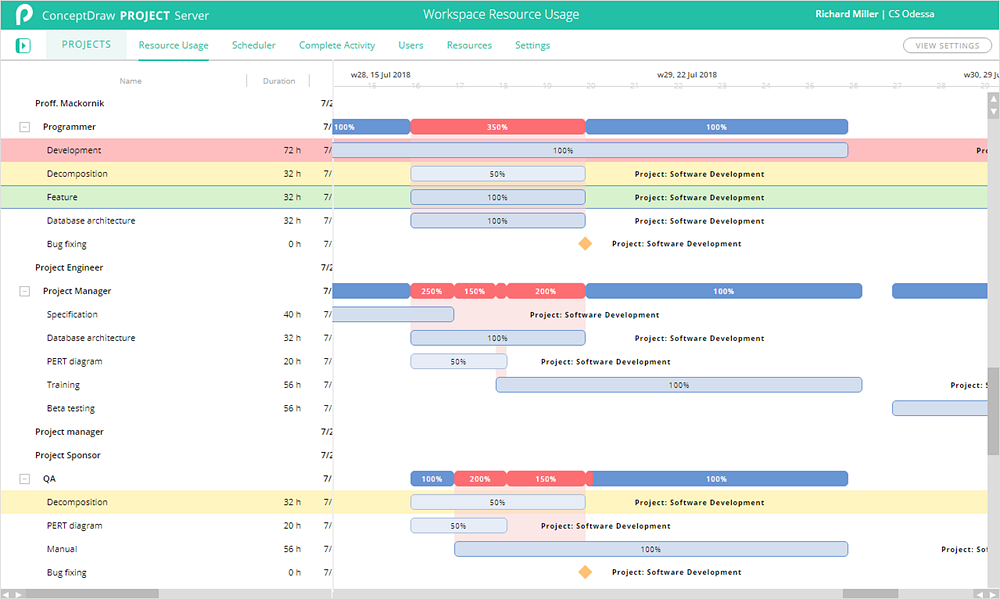
How to Add a Color Marker to Project Task on a Gantt Chart

ConceptDraw PROJECT Server allows adding color markers to scheduled project tasks. A color marker is used to show whether a task is marked for further action or identification of some kind. You can use markers if you want to select certain tasks for further viewing, filtering, formatting, or editing in the offline mode.

Line Chart Examples

The Line Graphs solution from Graphs and Charts area of ConceptDraw Solution Park contains a set of examples, templates and design elements library of line and scatter charts. Use it to draw line and scatter graphs using ConceptDraw DIAGRAM diagramming and vector drawing software for illustrating your documents, presentations and websites.

Chart Templates

Easy charting software comes with beautiful chart templates and examples. This makes it easy to create professional charts without prior experience.

Basic Flowchart Symbols and Meaning

Flowchart Symbols and Meaning - Provides a visual representation of basic flowchart symbols and their proposed use in professional workflow diagram, standard process flow diagram and communicating the structure of a well-developed web site, as well as their correlation in developing on-line instructional projects. See flowchart's symbols by specifics of process flow diagram symbols and workflow diagram symbols.
How to Build a Flowchart
HelpDesk

How to Create a Timeline Diagram

A Timeline is a chart which displays a project plan schedule in chronological order. A Timeline is used in project management to depict project milestones and visualize project phases and show project progress. The graphic form of a timeline makes it easy to understand critical project milestones, such as the progress of a project schedule. Timelines are particularly useful for project scheduling or project management when accompanied with a Gantt chart. It captures the main of what the project will accomplish and how it will be done. making a project timeline is one of the most important skills a project manager needs have. Making comprehensive, accurate timelines allows you getting every project off in the best way. ConceptDraw DIAGRAM allows you to draw a timeline chart using a special library.

Interior Design. Office Layout Plan Design Element

While developing an office layout, it is important to choose a right office space. One should take into account that some layouts are suitable for frequent communication among employees and are inappropriate for a high level of concentration, and vice versa, private offices are not convenient for frequent communication.
ConceptDraw Building Drawing Tools - draw simple office layout plans easily with Office Layout Plan Design Element. Use it to draw office interior design floor plans, office furniture and equipment layouts, and blueprints for facilities management, move management, office supply inventories, assets inventories, office space planning.
How to Draw a Floor Plan

Emergency Plan

Fire emergency plan need to be in every building on each floor. The evacuation plan preliminary designed in ConceptDraw DIAGRAM software will help employees or family members when natural disasters, fires, hazardous leaks and other disaster events happen. Start drawing emergency blueprint from floor bounds, then put the inner walls and doors, and finally use arrows to show evacuation directions to fire exits.
How to Draw a Floor Plan

Chart Examples

Easy charting software comes with beautiful chart templates and examples. This makes it easy to create professional charts without prior experience.

Business Process Flowchart Symbols

The business process flowchart symbols used for business process mapping are predefined by Business Process Modeling Notation (BPMN) and actually have their roots in the data processing diagrams and programming flow charts. Business Process flowchart symbols provide drawing business process flowcharts, diagrams and maps of any complexity.