Business Process Optimization
Optimize a Workflow
IDEF0 standard with ConceptDraw DIAGRAM

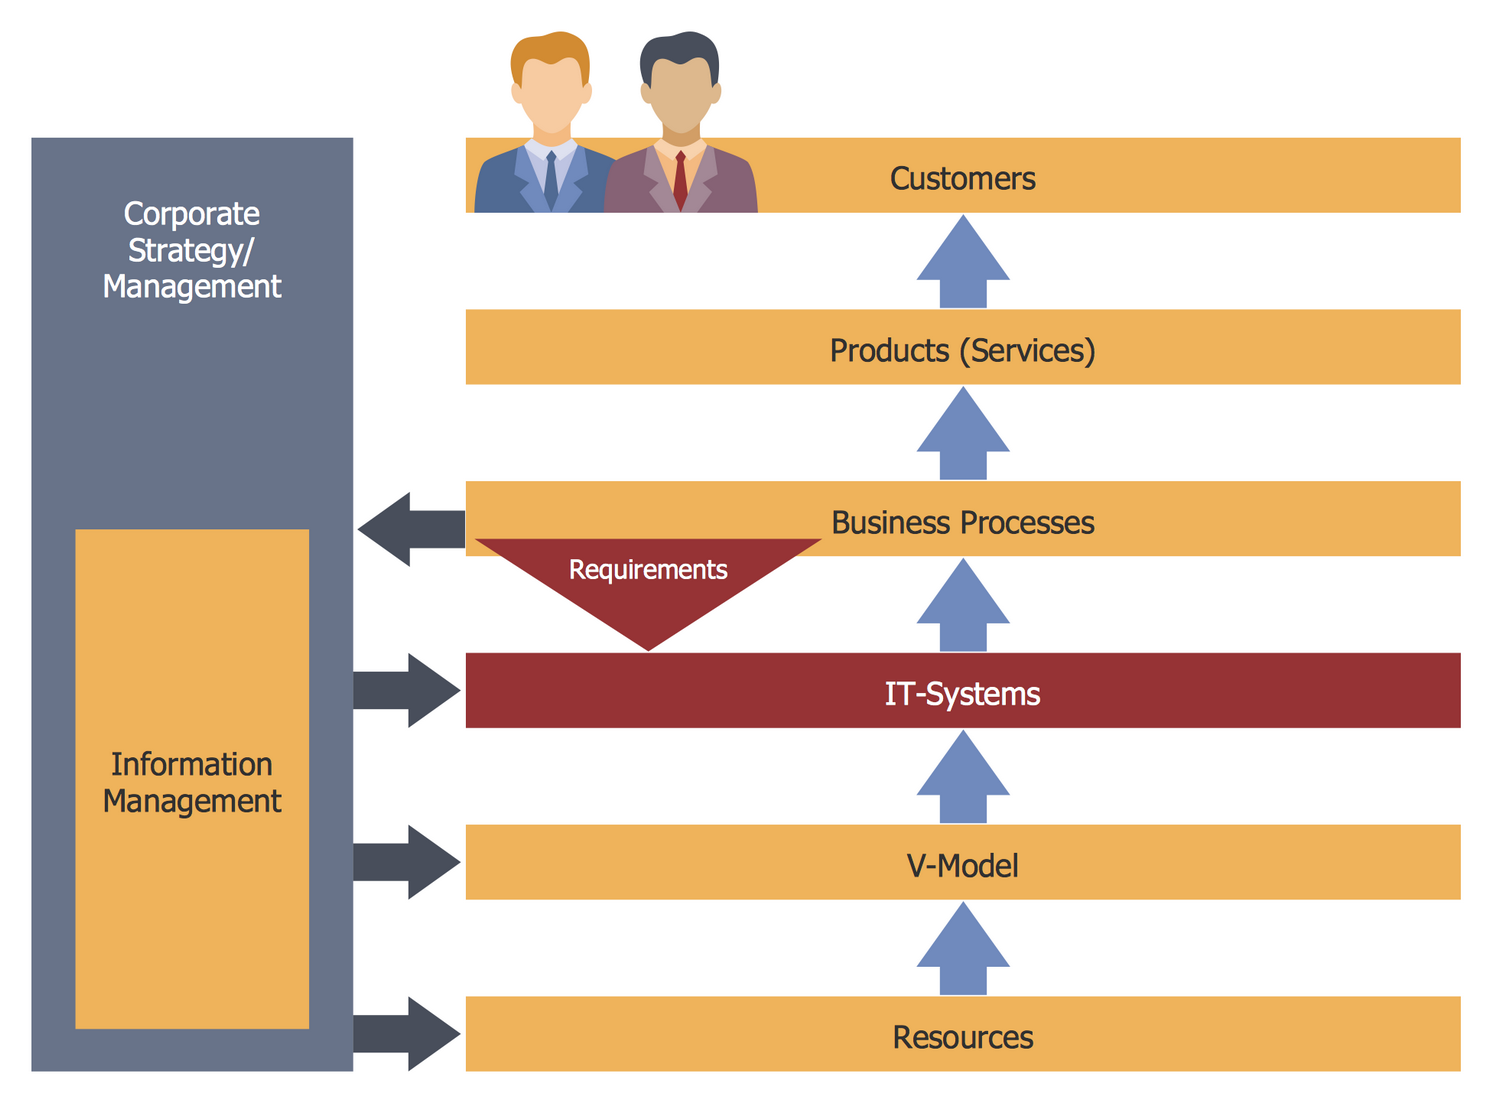
According to the IDEF0 standard any process can be described in the form of a block (Activity Box) which has inputs and outputs. The process consists in transformation of inputs into outputs under the influence of the management and in the presence of necessary resources. Outputs of the given process later on can be either inputs for the next process or resources, or management means.
Cross Functional Flowchart Examples

 Logistics Flow Charts
Logistics Flow Charts solution extends ConceptDraw DIAGRAM functionality with opportunities of powerful logistics management software. It provides large collection of predesigned vector logistic symbols, pictograms, objects and clipart to help you design with pleasure Logistics flow chart, Logistics process flow diagram, Inventory flow chart, Warehouse flowchart, Warehouse management flow chart, Inventory control flowchart, or any other Logistics diagram. Use this solution for logistics planning, to reflect logistics activities and processes of an enterprise or firm, to depict the company's supply chains, to demonstrate the ways of enhancing the economic stability on the market, to realize logistics reforms and effective products' promotion.
SIPOC Diagram

You need to draw professional looking SIPOC Diagram quick and easy? Pay please your attention on ConceptDraw DIAGRAM diagramming and vector drawing software. Extended with Business Process Mapping Solution from the Business Processes Area of ConceptDraw Solution Park, it suits ideal for this.
Graphics Software for Business
Software with different flowchart templates for each type of business will be your lifesaver. ConceptDraw DIAGRAM with its business samples, libraries and design elements is a point to start.
 Cross-Functional Flowcharts
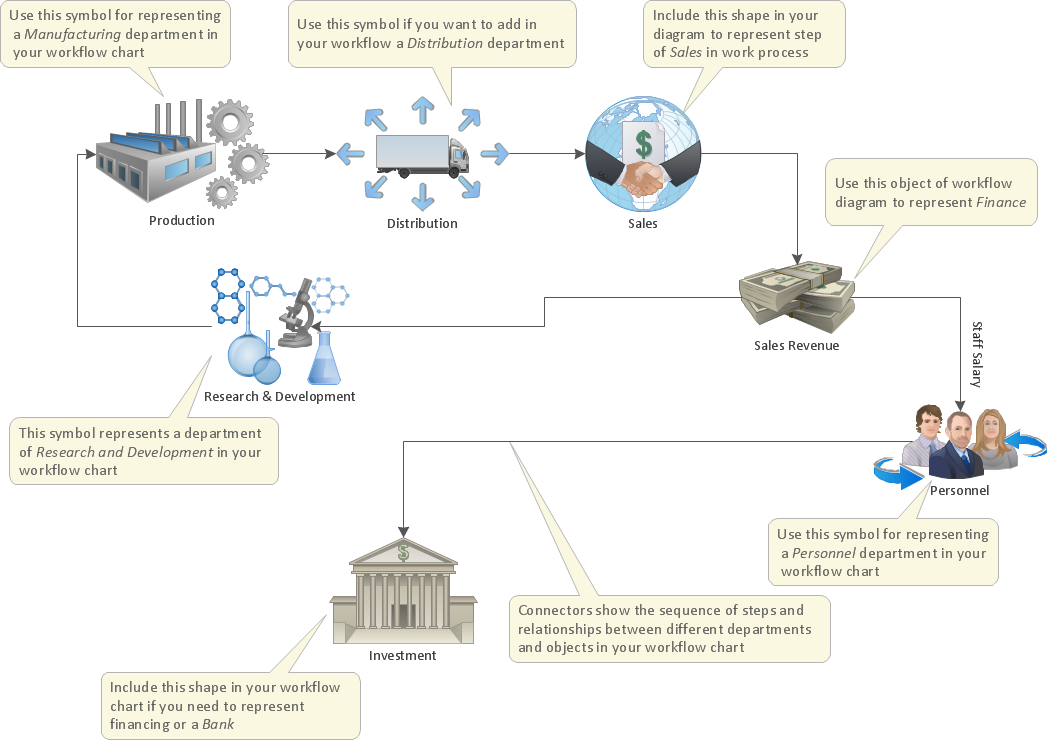
Cross-functional flowcharts are powerful and useful tool for visualizing and analyzing complex business processes which requires involvement of multiple people, teams or even departments. They let clearly represent a sequence of the process steps, the order of operations, relationships between processes and responsible functional units (such as departments or positions).
Sales Process Flowchart. Flowchart Examples

SWOT Analysis

- Mapping And Optimizing Processes
- How to Send an Outlook Email From a Mind Map | Software for ...
- Process Flowchart | Software for flowchart diagrams | Top 5 Android ...
- Operation Flow Chart Process Of Fast Food Restaurant
- Process Flowchart | Cross-Functional Flowchart | Online Flow Chart ...
- Business Process Flowchart Symbols | Types of Flowcharts | Cloud ...
- Software for flowchart diagrams | Flowchart design. Flowchart ...
- Press Room
- Business Structure | Basic Flowchart Symbols and Meaning ...
- Mechanical Engineering | Design elements - HVAC ductwork | Basic ...
- ERD | Entity Relationship Diagrams, ERD Software for Mac and Win
- Flowchart | Basic Flowchart Symbols and Meaning
- Flowchart | Flowchart Design - Symbols, Shapes, Stencils and Icons
- Flowchart | Flow Chart Symbols
- Electrical | Electrical Drawing - Wiring and Circuits Schematics
- Flowchart | Common Flowchart Symbols
- Flowchart | Common Flowchart Symbols