Process Flowchart
ConceptDraw is Professional business process mapping software for making process flow diagram, workflow diagram, general flowcharts and technical illustrations for business documents. It is includes rich examples, templates, process flowchart symbols. ConceptDraw flowchart maker allows you to easier create a process flowchart. Use a variety of drawing tools, smart connectors, flowchart symbols and shape libraries to create flowcharts of complex processes, process flow diagrams, procedures and information exchange.
Simple Drawing Applications for Mac
ConceptDraw gives the ability to draw simple diagrams like flowcharts, block diagrams, bar charts, histograms, pie charts, divided bar diagrams, line graphs, area charts, scatter plots, circular arrows diagrams, Venn diagrams, bubble diagrams, concept maps, and others.Venn Diagram Examples for Problem Solving. Environmental Social Science. Human Sustainability Confluence
The Venn diagram example below shows sustainable development at the confluence of three constituent parts.Create your Venn diagrams for problem solving in environmental social science using the ConceptDraw PRO diagramming and vector drawing software extended with the Venn Diagrams solution from the area "Diagrams" of ConceptDraw Solution Park.
UML Deployment Diagram. Design Elements
UML Deployment diagram describes the hardware used in system implementations and the execution environments and artifacts deployed on the hardware.ConceptDraw has 393 vector stencils in the 13 libraries that helps you to start using software for designing your own UML Diagrams. You can use the appropriate stencils of UML notation from UML Deployment library.
Bar Diagrams for Problem Solving. Create manufacturing and economics bar charts with Bar Graphs Solution
Create bar charts for visualizing problem solving in manufacturing and economics using the ConceptDraw PRO diagramming and vector drawing software extended with the Bar Graphs Solution from the Graphs and Charts area of ConceptDraw Solition Park.Draw Fishbone Diagram on MAC Software
There are many tools to facilitate the problem solving process. Cause and Effect diagram, or Fishbone diagram is one of them. Fishbone diagram can be constructed following 5 simple steps.Professional diagramming ConceptDraw PRO MAC OSX software with Fishbone Diagrams solution helps you make cause and effect analysis, identify the possible causes for an effect for problem solving, draw Fishbone diagram on Mac software aka Ishikawa diagram from brainstorm, templates and examples.
Product Overview
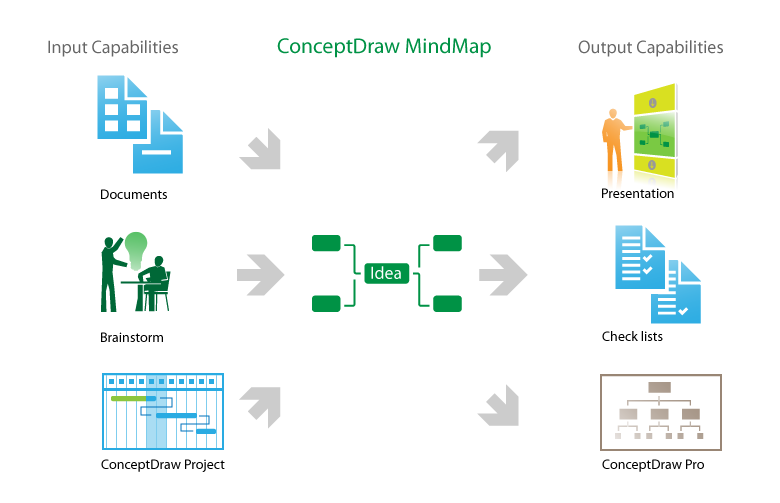
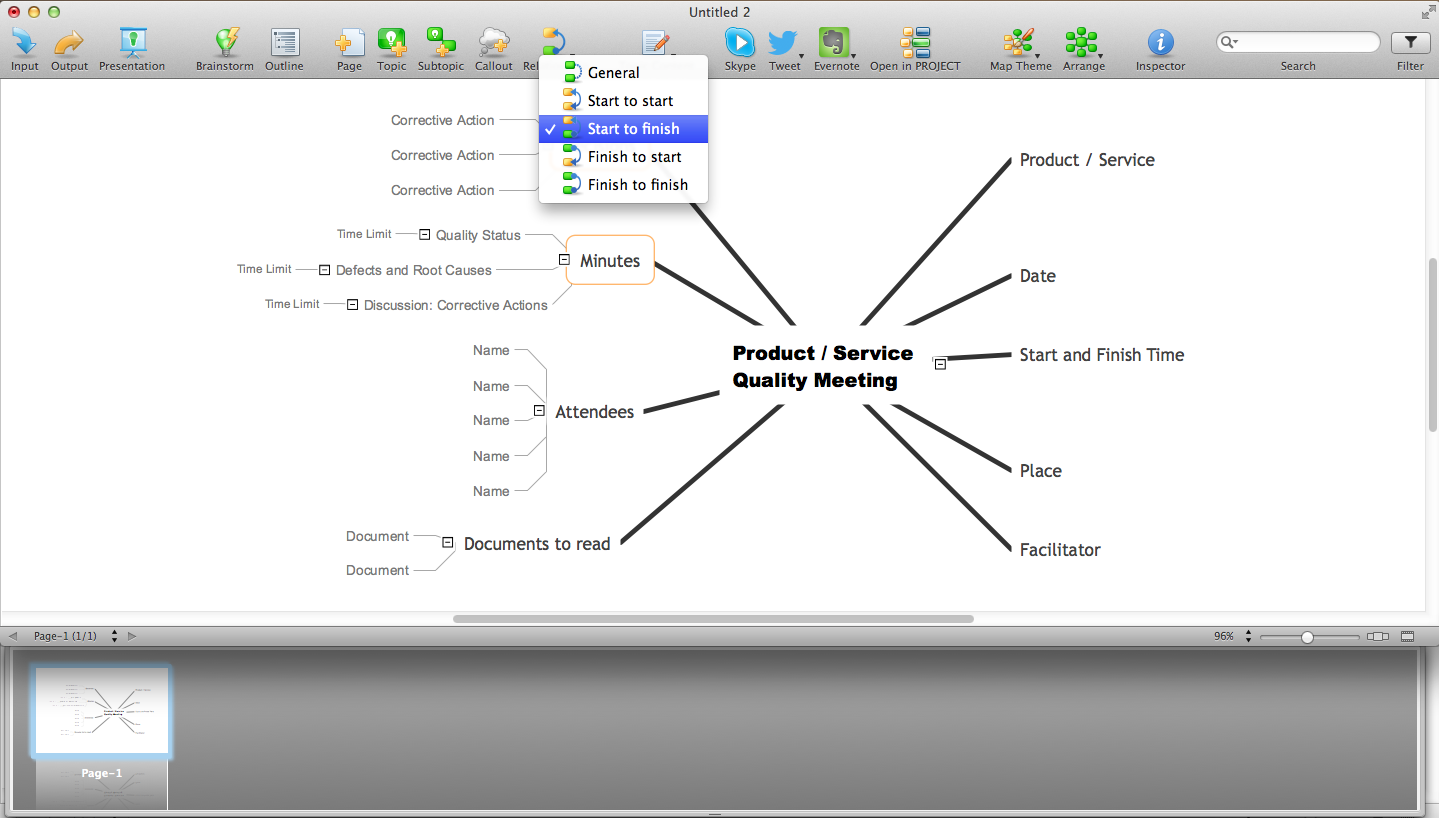
The role of ConceptDraw MINDMAP is to organize and plan idea development and communicate between process participants. Mind maps are convenient to prepare presentations for team and management and send task lists and related information.SWOT Analysis
The SWOT Analysis provides information that is helpful in matching the firm's resources and capabilities to the competitive environment in which it operates. As such, it is instrument in strategy formulation and selection. SWOT analysis is a method of strategic planning which identifies the factors internal and external environment of the firm and divides them into 4 categories: strengths, weaknesses, opportunities and threats. The ConceptDraw PRO and MINDMAP software allow professional to make well-designed SWOT matrix in minutes.ConceptDraw PRO: Able to Leap Tall Buildings in a Single Bound
ConceptDraw PRO is the world’s premier cross-platform business-diagramming tool. Many, who are looking for an alternative to Visio, are pleasantly surprised with how well they can integrate ConceptDraw PRO into their existing processes. With tens of thousands of template objects, and an easy method for importing vital custom objects from existing Visio documents, ConceptDraw PRO is a powerful tool for making extremely detailed diagrams, quickly and easily.Why People Select ConceptDraw MINDMAP
ConceptDraw MINDMAP an Alternative to MindJet MindManager - The power, economy, and versatility of ConceptDraw MINDMAP takes personnel and team productivity to another level. Discover today what this means to you.Emergency Plan
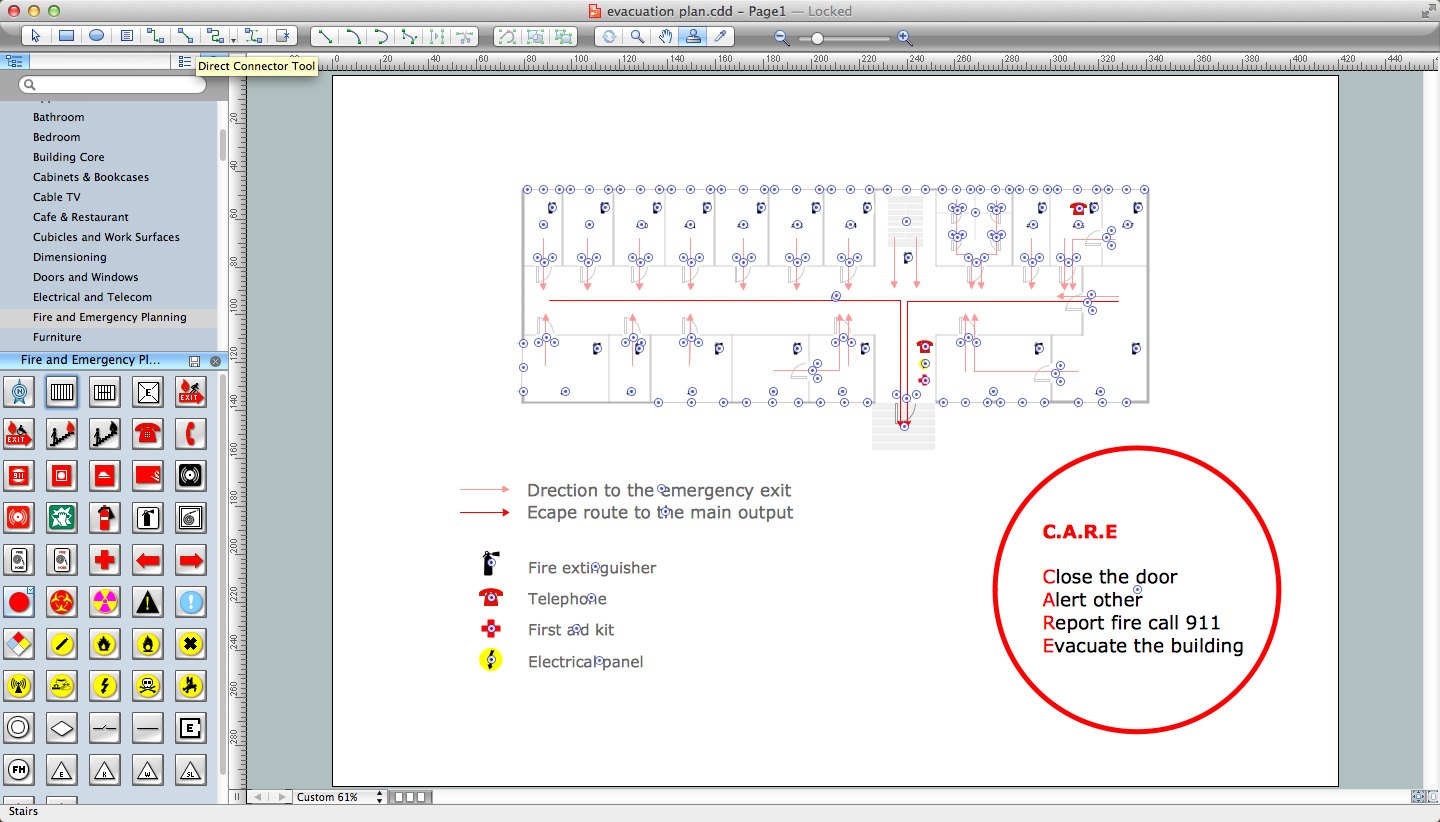
Fire emergency plan need to be in every building on each floor. The evacuation plan preliminary designed in ConceptDraw PRO software will help employees or family members when natural disasters, fires, hazardous leaks and other disaster events happen. Start drawing emergency blueprint from floor bounds, then put the inner walls and doors, and finally use arrows to show evacuation directions to fire exits.
In searching of alternative to MS Visio for MAC and PC with ConceptDraw PRO
Many of us are acquainted with such a software product as MS Visio, which beyond any doubt, is a powerful and multifunctional tool. However, there may occur instances when this program turns incapable of meeting certain users' requirements; and then, the most optimum solution is quite difficult to find. But there is always an alternative. ConceptDraw PRO from CS Odessa Corporation has been developed to satisfy all your needs as an alternative product to Visio.Visio for mac — ConceptDraw as an alternative to MS Visio. ConceptDraw has been developed to satisfy all your needs as a fully-functioned alternative product to MS Visio for Mac.
Cause and Effect Diagram Software
The Cause and Effect diagram introduced by Kaoru Ishikawa in 1968 is a method for analyzing process dispersion. It can help you to dive into a problem and find an effective solution, identify and represent the possible causes for an effect, analyze the complex business problems and successfully solve them.You can design your Cause and Effect diagram on a paper, but more effective way is to use specific software - ConceptDraw PRO is a powerful Cause and Effect Diagram Software. It helps you create Cause and Effect diagram known also as Fishbone diagram or Ishikawa diagram from templates and examples.
Network Diagram Software LAN Network Diagrams & Diagrams for LAN Physical Office Network Diagrams
ConceptDraw - Perfect Network Diagramming Software with examples of WAN, LAN Diagrams. ConceptDraw Network Diagram is ideal for network engineers and network designers who need to draw Local Area Network diagrams, physical office network diagrams and Diagram for LAN.
- Example Mind Map Of Marketing Environment
- Conceptdraw.com: Mind Map Software, Drawing Tools | Project ...
- Draw The Diagram Of Business Environment
- Business Environment Drawing
- Draw A Diagram Of Business Environment
- Marketing Environment Diagram Chart
- Draw A Diagram To Illustrate File Processing System Environment
- Draw The Diagram Of Market Environment
- Venn Diagram Examples for Problem Solving. Environmental Social ...
- Nature | How to Draw a Natural Landscape | Maps | Solution ...
- Types of Flowcharts | Venn Diagram Examples for Problem Solving ...
- Marketing Environment Flow Charts
- Simple Drawing Applications for Mac | Network Diagram Software ...
- Marketing Area | Target and Circular Diagrams | Micro Environment ...
- Stakeholder Mapping Tool | Stakeholder Onion Diagrams ...
- Manufacturing and Maintenance | Energy resources diagram ...
- Diagram Of Micro And Macro Environment
- Stakeholder Onion Diagrams | Visualize Stakeholder Analysis ...
- Diagram Of Business Environment That Shows All The Elements
- Marketing Environment Diagram
- ERD | Entity Relationship Diagrams, ERD Software for Mac and Win
- Flowchart | Basic Flowchart Symbols and Meaning
- Flowchart | Flowchart Design - Symbols, Shapes, Stencils and Icons
- Flowchart | Flow Chart Symbols
- Electrical | Electrical Drawing - Wiring and Circuits Schematics
- Flowchart | Common Flowchart Symbols
- Flowchart | Common Flowchart Symbols


