Flow chart Example. Warehouse Flowchart

Standard warehousing process flow diagram and standard workflow diagram used for process identification for further evaluating effectiveness and profitability of overall business process. Use the ConceptDraw PRO diagramming and vector drawing software extended with the Flowcharts solution from the Diagrams area of ConceptDraw Solution Park to design your own workflow diagrams, process flow diagram and flow charts. Need to use Process Flow Diagram for designing Warehouse packages flow.

Process Flowchart


Work Order Process Flowchart. Business Process Mapping Examples

The cross-functional flow chart example shows business process mapping of the real property work order.
Lean Six Sigma Diagram Software

Planogram Software and Retail Plan Software

Cross-Functional Flowchart

Use cross-functional flowcharts to show the relationship between a business process and the functional units (such as departments) responsible for that process. To create it use the best flowchart maker of ConceptDraw PRO.

 Fishbone Diagrams
The Fishbone Diagrams solution extends ConceptDraw PRO v10 software with the ability to easily draw the Fishbone Diagrams (Ishikawa Diagrams) to clearly see the cause and effect analysis and also problem solving. The vector graphic diagrams produced using this solution can be used in whitepapers, presentations, datasheets, posters, and published technical material.
 Entity-Relationship Diagram (ERD)
Entity-Relationship Diagram (ERD) solution extends ConceptDraw PRO software with templates, samples and libraries of vector stencils from drawing the ER-diagrams by Chen's and crow’s foot notations.
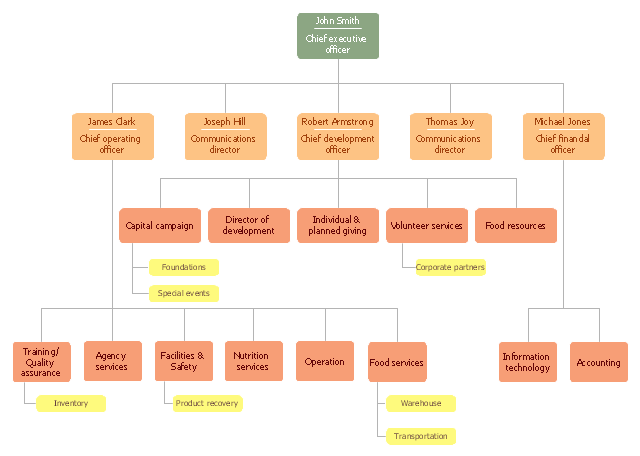
"A food bank or foodbank is a non-profit, charitable organization that distributes food to those who have difficulty purchasing enough food to avoid hunger.
In the United States and Australia, food banks usually operate on the "warehouse" model. They act as food storage and distribution depots for smaller front line agencies; and usually do not themselves give out food directly to the hungry. After the food is collected, sorted, and reviewed for quality, these food banks distribute it to non-profit community or government agencies, including food pantries, food closets, soup kitchens, homeless shelters, orphanages, and schools.
Outside North America and Australia, the "front line" model is often found. Such food banks give out most or all of their food directly to the end users. For both models, the largest sources of food include for-profit growers, manufacturers, distributors and retailers who in the normal course of business have excess food that they cannot sell. Some foodbanks receive a substantial proportion of their food from individual donors, including their volunteer workers. There is considerable overlap with food salvage, food rescue and gleaning, although not with freeganism or dumpster-diving." [Food bank. Wikipedia]
The organization chart example "Foodbank" was created using the ConceptDraw PRO diagramming and vector drawing software extended with the Organizational Charts solution from the Management area of ConceptDraw Solution Park.
Organizational chart
- Manufacturing Flow Chart For Retailers
- Process Flow Chart For Store Department
- Flow chart Example. Warehouse Flowchart | Explain Services Of ...
- Production Plan Flow Chart For A Boutique Business Plan
- Store Depart Working Flow Chart
- Flowchart For Retail Operations For The Functions
- Design Of A Flow Chart For A Manufacturing Process
- Retail Business Operation Process Flow Chart
- Example of DFD for Online Store (Data Flow Diagram )
- Process Flow Chart For Store
- Process Flowchart | Flow chart Example. Warehouse Flowchart ...
- Manufacturing in America | Wholesale And Retailers Simple Bar ...
- Sales Process Flowchart . Flowchart Examples | Sales Process ...
- Retail Flowchart
- Online store social media response flowchart | Flow chart Example ...
- Example of DFD for Online Store (Data Flow Diagram ) DFD ...
- Flowchart Of Manufacturing To Retail
- Process Flowchart | Flow chart Example. Warehouse Flowchart ...
- Process Flowchart | Flowchart Marketing Process. Flowchart ...
- Process Flowchart | Flow chart Example. Warehouse Flowchart ...
- ERD | Entity Relationship Diagrams, ERD Software for Mac and Win
- Flowchart | Basic Flowchart Symbols and Meaning
- Flowchart | Flowchart Design - Symbols, Shapes, Stencils and Icons
- Flowchart | Flow Chart Symbols
- Electrical | Electrical Drawing - Wiring and Circuits Schematics
- Flowchart | Common Flowchart Symbols
- Flowchart | Common Flowchart Symbols