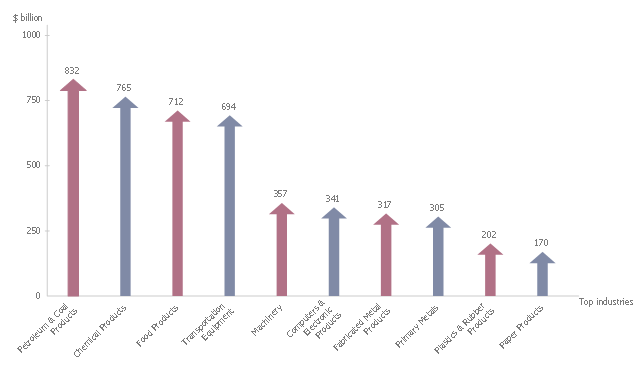
This arrows bar chart example shows the total value of manufacturers' shipments. It was drawn on the base of the infographics "Inside America's Economic Machine" from the website of the United States Census Bureau.
[census.gov/ how/ img/ Econ_ Infographic.jpg]
"The Advance Report on Durable Goods Manufacturer's Shipments, Inventories and Orders, or the Durable Goods Report, provides data on new orders received from more than 4,000 manufacturers of durable goods, which are generally defined as higher-priced capital goods orders with a useful life of three years or more, such as cars, semiconductor equipment and turbines.More than 85 industries are represented in the sample, which covers the entire United States." [Economic Indicators: Durable Goods Report. R. Barnes. investopedia.com/ university/ releases/ durablegoods.asp]
The arrow graph example "Total value of manufacturers' shipments" was created using the ConceptDraw PRO diagramming and vector drawing software extended with the Basic Picture Graphs solution from the Graphs and Charts area of ConceptDraw Solution Park.
Arrows bar chart
"Causes in the diagram are often categorized, such as to the 6 M's ...
The 6 Ms (used in manufacturing industry):
(1) Machine (technology);
(2) Method (process);
(3) Material (Includes Raw Material, Consumables and Information.);
(4) Man Power (physical work)/ Mind Power (brain work): Kaizens, Suggestions;
(5) Measurement (Inspection);
(6) Milieu/ Mother Nature (Environment).
The original 6Ms used by the Toyota Production System have been expanded by some to include the following and are referred to as the 8Ms. However, this is not globally recognized. It has been suggested to return to the roots of the tools and to keep the teaching simple while recognizing the original intent; most programs do not address the 8Ms.
(7) Management/ Money Power;
(8) Maintenance." [Ishikawa diagram. Wikipedia]
This 8Ms Ishikawa diagram (manufacturing cause and effect diagram) template is included in the Fishbone Diagram solution from the Management area of ConceptDraw Solution Park.
8Ms Ishikawa diagram

How Do Fishbone Diagrams Solve Manufacturing Problems

ConceptDraw DIAGRAM application extended with Fishbone Diagrams solution lets you construct Fishbone diagrams and represent globally recognized standards for manufacturing 6 Ms and 8 Ms.
Value-Stream Mapping for Manufacturing

 Manufacturing and Maintenance
Manufacturing and maintenance solution extends ConceptDraw DIAGRAM software with illustration samples, templates and vector stencils libraries with clip art of packaging systems, industrial vehicles, tools, resources and energy.
Bar Diagrams for Problem Solving. Create manufacturing and economics bar charts with Bar Graphs Solution

Lean Manufacturing Diagrams

- Total value of manufacturers ' shipments | Average energy prices for ...
- Picture graph - Template | Manufacturing in America | Total value of ...
- Welding Symbol For Manufacturing Drawing
- Manufacturing Floor Plan Layout
- How Do Fishbone Diagrams Solve Manufacturing Problems ...
- Explain Services Of Wholesalers Services To Manufacturers
- Total value of manufacturers ' shipments | Widget price correlation ...
- Arrow graph - Total value of manufacturers ' shipments | Venn ...
- Manufacturing 8 Ms fishbone diagram - Template | Fishbone ...
- Cross Functional Flowchart Examples | Manufacturing Process Flow ...
- ERD | Entity Relationship Diagrams, ERD Software for Mac and Win
- Flowchart | Basic Flowchart Symbols and Meaning
- Flowchart | Flowchart Design - Symbols, Shapes, Stencils and Icons
- Flowchart | Flow Chart Symbols
- Electrical | Electrical Drawing - Wiring and Circuits Schematics
- Flowchart | Common Flowchart Symbols
- Flowchart | Common Flowchart Symbols