Entity Relationship Diagram Symbols

ERD symbols used for professional ERD drawing are collected in libraries from the Entity-Relationship Diagram (ERD) solution for ConceptDraw DIAGRAM.
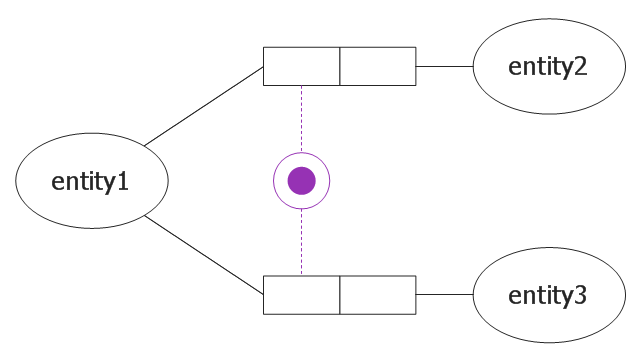
This object-role modeling (ORM) diagram sample shows disjunctive mandatory role constraint.
It was designed on the base of the Wikimedia Commons file: 9 DisjunktyvusPrivalomumoRibojimas.jpg. [commons.wikimedia.org/ wiki/ File:9_ DisjunktyvusPrivalomumoRibojimas.jpg]
"2.7. Mandatory Role Constraints.
The ORM 1 tool indicates simple mandatory constraints by a solid dot either (a) at the intersection of an entity type shape and the line connecting it to a role, or (b) at the role end. Option (b) is needed to avoid ambiguity when an object type plays many mandatory roles whose connections to the object type are too close to distinguish which role the dot applies to. Currently, disjunctive mandatory (inclusive-or) constraints are depicted by placing the solid dot in a circle connected by dotted lines to the roles it applies to. ORM 2 retains this notation, except that the solid dot is consistently colored violet and a global configuration option determines the default placement of simple mandatory dots at the role or object type end. Users may override this global setting on an individual role basis." [www.orm.net/ pdf/ ORM2_ TechReport1.pdf]
The object-role model example "Disjunctive mandatory constraint ORM diagram" was designed using ConceptDraw PRO software extended with ORM Diagrams solution from Software Development area of ConceptDraw PRO Solution Park.
Object role modeling
Network Diagram Software. LAN Network Diagrams. Physical Office Network Diagrams


ERD Symbols and Meanings

The Chen's ERD notation is still used and is considered to present a more detailed way of representing entities and relationships.
To create an ERD, software engineers mainly turn to dedicated drawing software, which contain the full notation resources for their specific database design - ERD symbols and meanings. CS Odessa has released an all-inclusive Entity-Relationship Diagram (ERD) solution for their powerful drawing program, ConceptDraw DIAGRAM.

 Object-Role Modeling (ORM) Diagrams
Object-role Modeling (ORM) Diagram solution with powerful vector diagramming and data modeling tools, large quantity of specially developed samples and examples, and rich variety of vector objects corresponding to common ORM notation, ideally suits for developing the comprehensive, clear and visual Object-role Modeling (ORM) diagrams and schematics, understandable for all interested people from the different fields and business directions, for designing the ORM models, and demonstrating advantages from the use of ORM and its notation. It is intended for software developers and computer engineers, specialists in a field of Object-oriented programming (OOP), database architects, web-application constructors and developers, etc.
UML Use Case Diagram. Design Elements
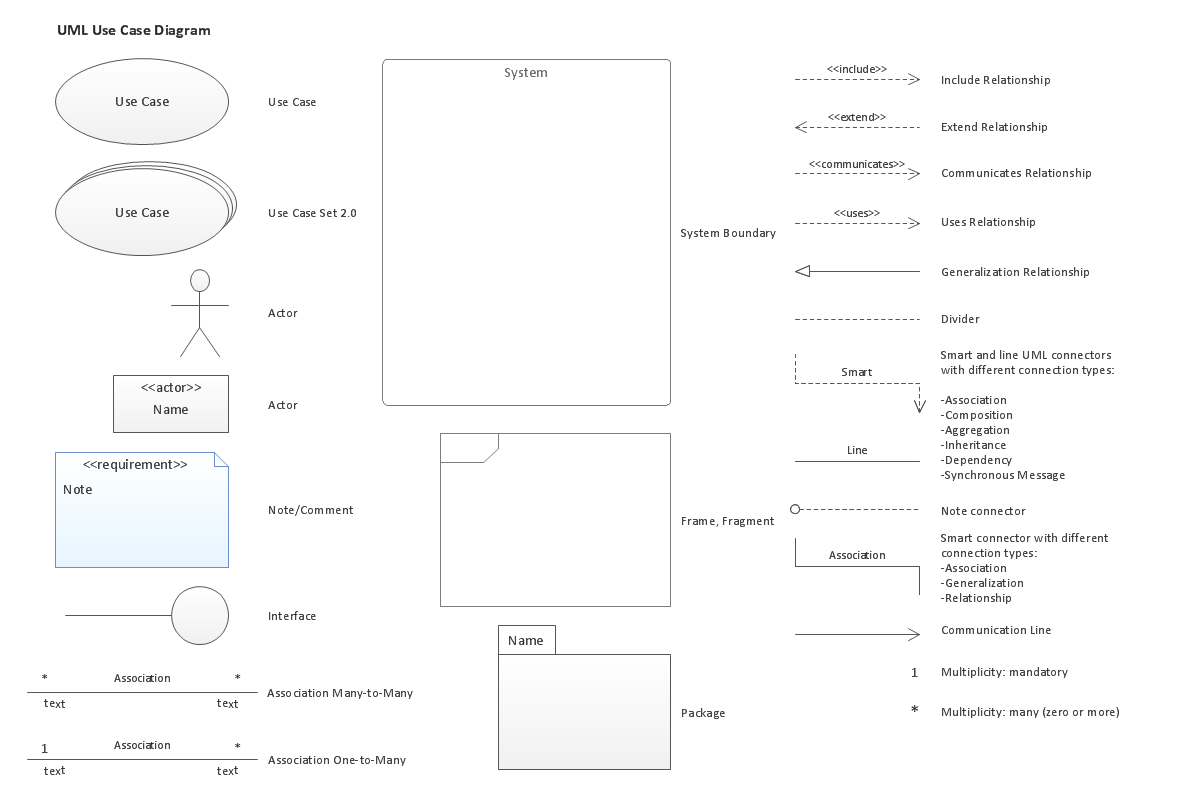

Diagramming Software for Design UML Use Case Diagrams

ORM Diagram

UML Use Case Diagrams

Financial Trade UML Use Case Diagram Example

This sample shows the work of the Financial Trade sphere and can be used by trading companies, commercial organizations, traders, different exchanges.
- Mandatory Software Diagrams
- Entity Relationship Diagram Symbols | ERD Symbols and Meanings ...
- Design elements - ERD (crow's foot notation) | Entity Relationship ...
- Scrum workflow | Scrum board | Scrum | Scrum Guide
- Basic Flowchart Symbols and Meaning | Audit Flowchart Symbols ...
- ERD Symbols and Meanings | Data Modeling with Entity ...
- HR management process - Flowchart | How to Create a HR Process ...
- How to Create a HR Process Flowchart Using ConceptDraw PRO ...
- UML Use Case Diagram Example. Services UML Diagram . ATM ...
- Chen Notation | Design elements - ER diagram (Chen notation ...
- ERD | Entity Relationship Diagrams, ERD Software for Mac and Win
- Flowchart | Basic Flowchart Symbols and Meaning
- Flowchart | Flowchart Design - Symbols, Shapes, Stencils and Icons
- Flowchart | Flow Chart Symbols
- Electrical | Electrical Drawing - Wiring and Circuits Schematics
- Flowchart | Common Flowchart Symbols
- Flowchart | Common Flowchart Symbols