HR infographics "Components of competency based management" was redesigned from the Wikipedia file: Competency-circle.jpg. [en.wikipedia.org/ wiki/ File:Competency-circle.jpg]
This file is licensed under the Creative Commons Attribution-ShareAlike 3.0 License. [creativecommons.org/ licenses/ by-sa/ 3.0/ ]
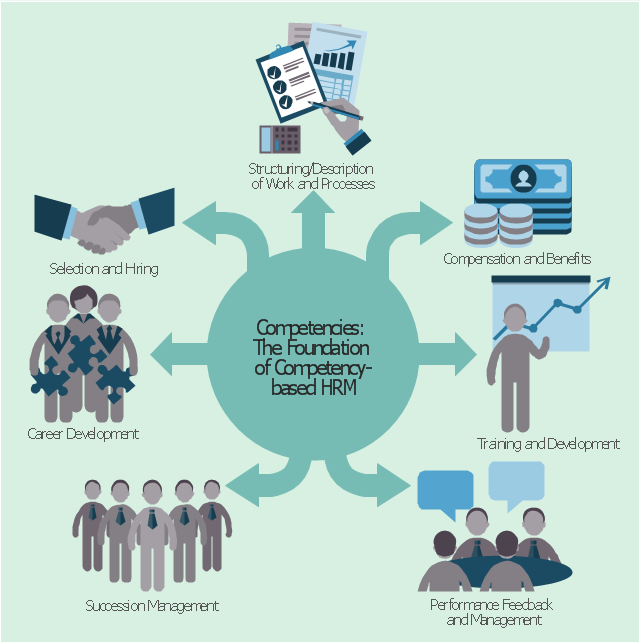
"Competency-based human resources planning serves as a link between human resources management and the overall strategic plan of an organization. Competencies are defined as observable abilities, skills, knowledge, motivations or traits defined in terms of the behaviours needed for successful job performance.
Competency-based management supports the integration of human resources planning with business planning by allowing organizations to assess the current human resource capacity based on their competencies against the capacity needed to achieve the vision, mission and business goals of the organization. Targeted human resource strategies, plans and programs to address gaps (e.g., hiring and staffing; learning; career development; succession management; etc.) are then designed, developed and implemented to close the gaps." [Competency-based management. Wikipedia]
The HR infographics example "Components of competency based management" was created using the ConceptDraw PRO diagramming and vector drawing software extended with the HR Flowcharts solution from the Management area of ConceptDraw Solution Park.
This file is licensed under the Creative Commons Attribution-ShareAlike 3.0 License. [creativecommons.org/ licenses/ by-sa/ 3.0/ ]
"Competency-based human resources planning serves as a link between human resources management and the overall strategic plan of an organization. Competencies are defined as observable abilities, skills, knowledge, motivations or traits defined in terms of the behaviours needed for successful job performance.
Competency-based management supports the integration of human resources planning with business planning by allowing organizations to assess the current human resource capacity based on their competencies against the capacity needed to achieve the vision, mission and business goals of the organization. Targeted human resource strategies, plans and programs to address gaps (e.g., hiring and staffing; learning; career development; succession management; etc.) are then designed, developed and implemented to close the gaps." [Competency-based management. Wikipedia]
The HR infographics example "Components of competency based management" was created using the ConceptDraw PRO diagramming and vector drawing software extended with the HR Flowcharts solution from the Management area of ConceptDraw Solution Park.
HR Infographics
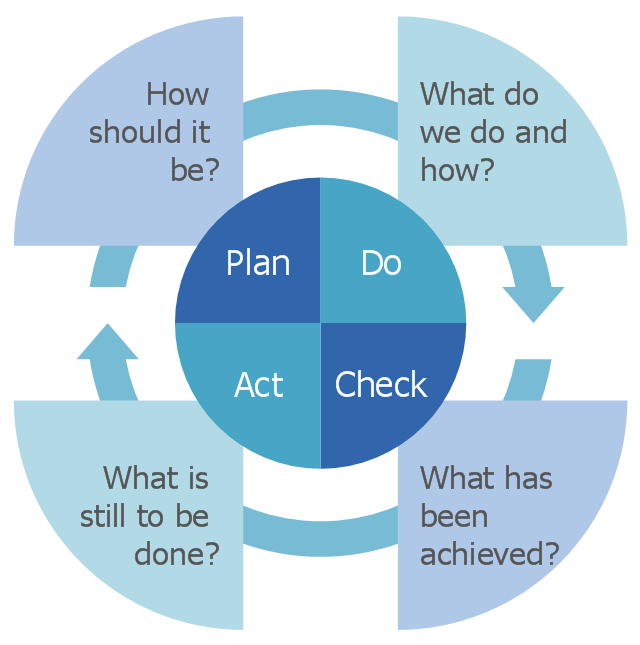
This Deming cycle sample shows plan-do-check-act diagram.
It was designed on the base of Wikimedia Commons file: PDCA-Kreis (Qualitätsmanagement) mit Beschriftung.svg. [commons.wikimedia.org/ wiki/ File:PDCA-Kreis_ (Qualitätsmanagement)_ mit_ Beschriftung.svg]
This file is licensed under the Creative Commons Attribution-Share Alike 3.0 Unported license. [creativecommons.org/ licenses/ by-sa/ 3.0/ deed.en]
"PDCA was made popular by Dr W. Edwards Deming, who is considered by many to be the father of modern quality control; however, he always referred to it as the "Shewhart cycle"." [PDCA. Wikipedia]
"Quality management ensures that an organization, product or service is consistent. It has four main components: quality planning, quality assurance, quality control and quality improvement. Quality management is focused not only on product and service quality, but also on the means to achieve it. Quality management, therefore, uses quality assurance and control of processes as well as products to achieve more consistent quality." [Quality management. Wikipedia]
The plan-do-check-act diagram example "Quality management PDCA" was designed using ConceptDraw PRO software extended with Plan-Do-Check-Act (PDCA) solution from Management area of ConceptDraw Solution Park.
Diagram example
"Task management is the process of managing tasks through its life cycle. It involves planning, testing, tracking and reporting. Task management can help either individuals achieve goals, or groups of individuals collaborate and share knowledge for the accomplishment of collective goals. Tasks are also differentiated by complexity, from low to high.
Effective task management requires managing all aspects of a task, including its status, priority, time, human and financial resources assignments, recurrency, notifications and so on. These can be lumped together broadly into the basic activities of task management. ...
Task management may form part of project management and process management and can serve as the foundation for efficient workflow in an organisation. Project managers adhering to task-oriented management have a detailed and up-to-date project schedule, and are usually good at directing team members and moving the project forward. ...
Task life cycle.
The status of tasks can be described by the following states:
Ready,
Assigned,
Terminated,
Expired,
Forwarded,
Finished,
Failed." [Task management. Wikipedia]
The example "Project management task status dashboard" was created using the ConceptDraw PRO diagramming and vector drawing software extended with the Status Dashboard solution from the area "What is a Dashboard" of ConceptDraw Solution Park.
Status dashboard

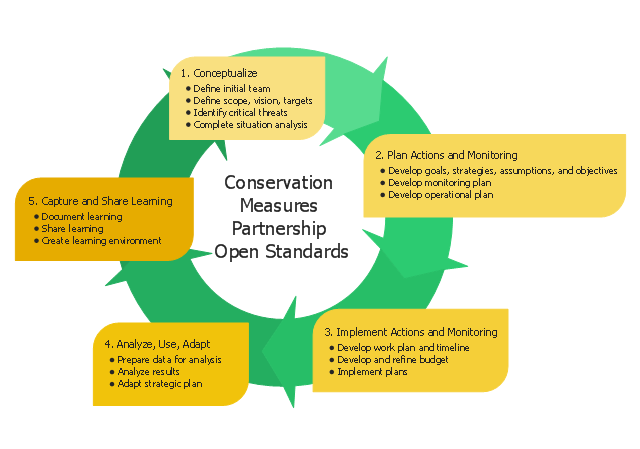
This circular arrows diagram sample shows five steps of the Conservation Measures Partnership (CMP) adaptive management cycle. It was designed on the base of the Wikimedia Commons file: CMP Cycle - 2008-02-20.jpg.
[commons.wikimedia.org/ wiki/ File:CMP_ Cycle_ -_ 2008-02-20.jpg]
"Adaptive management (AM), also known as adaptive resource management (ARM), is a structured, iterative process of robust decision making in the face of uncertainty, with an aim to reducing uncertainty over time via system monitoring. In this way, decision making simultaneously meets one or more resource management objectives and, either passively or actively, accrues information needed to improve future management. Adaptive management is a tool which should be used not only to change a system, but also to learn about the system. Because adaptive management is based on a learning process, it improves long-run management outcomes. The challenge in using the adaptive management approach lies in finding the correct balance between gaining knowledge to improve management in the future and achieving the best short-term outcome based on current knowledge.
Application to environmental projects and programs.
Open Standards for the Practice of Conservation lay out 5 main steps to an adaptive management project cycle." [Adaptive management. Wikipedia]
The diagram example "CMP adaptive management cycle" was created using the ConceptDraw PRO diagramming and vector drawing software extended with the Circular Arrows Diagrams solution from the area "What is a Diagram" of ConceptDraw Solution Park.
Circular arrows diagram
Used Solutions
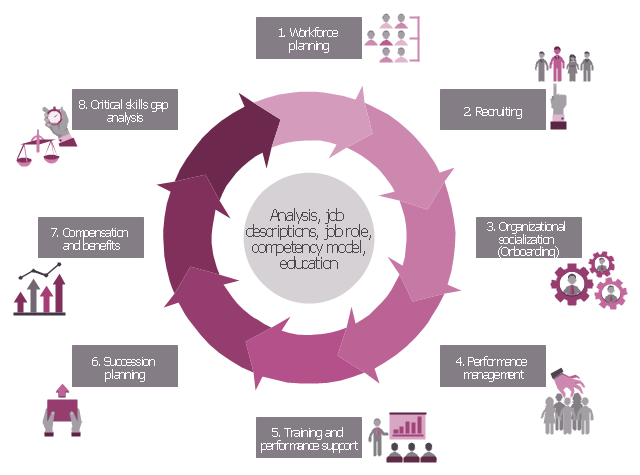
HR infographics "Talent management process" was redesigned from the Wikimedia Commons file: Model_ TM.jpg. [commons.wikimedia.org/ wiki/ File:Model_ TM.jpg]
"Talent management refers to the anticipation of required human capital for an organization and the planning to meet those needs. ...
Talent management is the science of using strategic human resource planning to improve business value and to make it possible for companies and organizations to reach their goals. Everything done to recruit, retain, develop, reward and make people perform forms a part of talent management as well as strategic workforce planning. A talent-management strategy needs to link to business strategy to make sense." [Talent management. Wikipedia]
The HR infographics example "Talent management process" was created using the ConceptDraw PRO diagramming and vector drawing software extended with the HR Flowcharts solution from the Management area of ConceptDraw Solution Park.
HR infographics
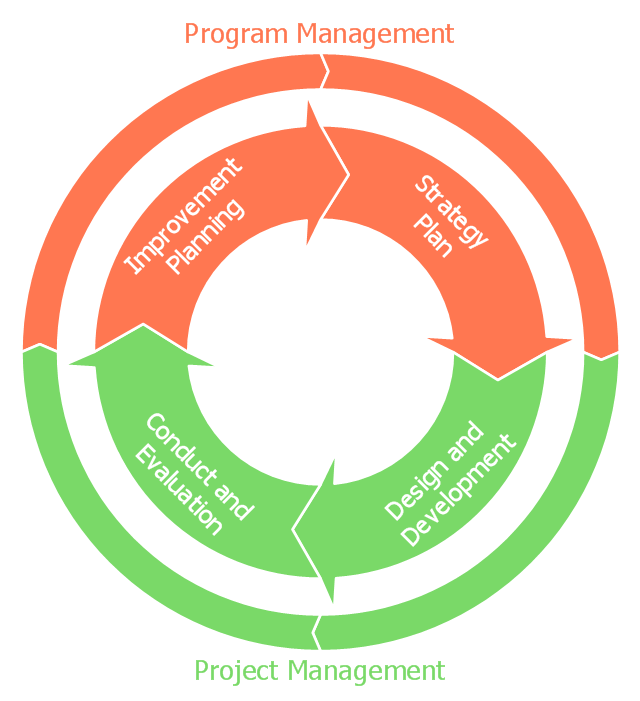
This circular arrows diagram sample shows the exercise cycle stages: 1) Strategy plan, 2) Design and development, 3) Conduct and evaluation, 4) Improvement planning. It was designed on the base of the diagram on the Emergency Management Insitute training IS-120.b webpage from the website of the Federal Emergency Management Agency (FEMA) of the United States Department of Homeland Security.
[emilms.fema.gov/ IS120A/ summary.htm]
"Exercises give communities, states, and regions a set of essential tools to prevent, prepare for, respond to, and recover from disasters." [emilms.fema.gov/ IS120A/ module0.htm]
"Disaster management (or emergency management) is the creation of plans through which communities reduce vulnerability to hazards and cope with disasters. Disaster management does not avert or eliminate the threats; instead, it focuses on creating plans to decrease the effect of disasters. Failure to create a plan could lead to human mortality, lost revenue, and damage to assets. Currently in the United States 60 percent of businesses do not have emergency management plans. Events covered by disaster management include acts of terrorism, industrial sabotage, fire, natural disasters (such as earthquakes, hurricanes, etc.), public disorder, industrial accidents, and communication failures." [Emergency management. Wikipedia]
The diagram example "Emergency management exercise cycle" was created using the ConceptDraw PRO diagramming and vector drawing software extended with the Basic Circular Arrows Diagrams solution from the area "What is a Diagram" of ConceptDraw Solution Park.
Circular arrows diagram
This circular arrows diagram sample shows the process of emergency management involving four phases: Mitigation, Preparedness, Response, and Recovery. It was designed on the base of the webpage "Emergency Management" on the website of the Downey City Hall, California, U.S.
"The process of emergency management involves four phases: Mitigation, Preparedness, Response, and Recovery. ...
Mitigation efforts attempt to prevent hazards from developing into disasters altogether, or to reduce the effects of disasters when they occur. The mitigation phase differs from the other phases because it focuses on long-term measures for reducing or eliminating risk. ...
In the preparedness phase, emergency managers develop plans of action for when the disaster strikes. ...
The response phase includes the mobilization of the necessary emergency services and first responders in the disaster area. This is likely to include a first wave of core emergency services, such as firefighters, police and EMS crews. ...
The aim of the recovery phase is to restore the affected area to its previous state. It differs from the response phase in its focus; recovery efforts are concerned with issues and decisions that must be made after immediate needs are addressed. Recovery efforts are primarily concerned with actions that involve rebuilding destroyed property, re-employment, and the repair of other essential infrastructure."
[downeyca.org/ gov/ emergency/ default.asp]
"Disaster management (or emergency management) is the creation of plans through which communities reduce vulnerability to hazards and cope with disasters. Disaster management does not avert or eliminate the threats; instead, it focuses on creating plans to decrease the effect of disasters. Failure to create a plan could lead to human mortality, lost revenue, and damage to assets. Currently in the United States 60 percent of businesses do not have emergency management plans. Events covered by disaster management include acts of terrorism, industrial sabotage, fire, natural disasters (such as earthquakes, hurricanes, etc.), public disorder, industrial accidents, and communication failures." [Emergency management. Wikipedia]
The arrow circle diagram example "Emergency management process" was created using the ConceptDraw PRO diagramming and vector drawing software extended with the Circular Arrows Diagrams solution from the area "What is a Diagram" of ConceptDraw Solution Park.
Arrow circle diagram
Used Solutions
The vector stencils library "Workflow management" contains 22 icons.
Use it to design your business process workflow diagrams with ConceptDraw PRO software.
"Management in businesses and organizations is the function that coordinates the efforts of people to accomplish goals and objectives by using available resources efficiently and effectively.
Management includes planning, organizing, staffing, leading or directing, and controlling an organization to accomplish the goal or target. Resourcing encompasses the deployment and manipulation of human resources, financial resources, technological resources, and natural resources." [Management. Wikipedia]
The icons example "Design elements - Workflow management" is included in the Business Process Workflow Diagrams solution from the Business Processes area of ConceptDraw Solution Park.
Management icons
This example was created on the base of the Georgia DOT Performance Management Dashboard from the Georgia Department of Transportation website.
[dot.ga.gov/ informationcenter/ statistics/ performance/ Pages/ default.aspx]
"Performance management (PM) includes activities which ensure that goals are consistently being met in an effective and efficient manner. Performance management can focus on the performance of an organization, a department, employee, or even the processes to build a product of service, as well as many other areas.
PM is also known as a process by which organizations align their resources, systems and employees to strategic objectives and priorities.
Performance management originated as a broad term coined by Dr. Aubrey Daniels in the late 1970s to describe a technology (i.e. science imbedded in applications methods) for managing both behavior and results, two critical elements of what is known as performance. A formal definition of performance management, according to Daniels' is "a scientifically based, data-oriented management system. It consists of three primary elements-measurement, feedback and positive reinforcement."" [Performance management. Wikipedia]
The meter dashboard example "Georgia DOT Performance Management" was created using the ConceptDraw PRO diagramming and vector drawing software extended with the Meter Dashboard solution from the area "What is a Dashboard" of ConceptDraw Solution Park.
Meter dashboard

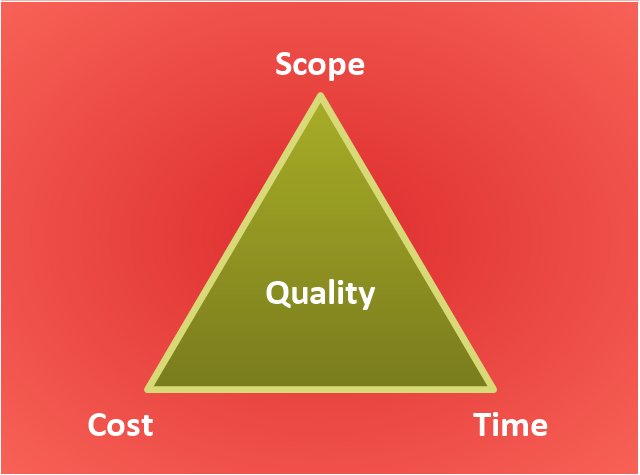
"The Project Management Triangle (called also Triple Constraint or the Iron Triangle) is a model of the constraints of project management. It is a graphic aid where the three attributes show on the corners of the triangle to show opposition. It is useful to help with intentionally choosing project biases, or analyzing the goals of a project. It is used to illustrate that project management success is measured by the project team's ability to manage the project, so that the expected results are produced while managing time and cost." [Project management triangle. Wikipedia]
The pyramid chart example "Project management triangle diagram" was redesigned using the ConceptDraw PRO diagramming and vector drawing software from Wikimedia Commons file Project-triangle-en.svg. [commons.wikimedia.org/ wiki/ File:Project-triangle-en.svg]
The project management triangle chart example is included in the Pyramid Diagrams solution from the Marketing area of ConceptDraw Solution Park.
Pyramid diagram
- Management Wikipedia The
- Total Quality Management Value | A Study of the Business Value of ...
- Workflow Management Wiki
- Components of competency based management | Green Hrm Wiki
- HR management process - Flowchart | Components of competency ...
- Components of competency based management | Talent ...
- Interrelationship Diagram Wikipedia
- ER Diagram Of Library Management Wikipedia
- Business Process Management Wiki
- Incentive Compensation Management Wiki
- ERD | Entity Relationship Diagrams, ERD Software for Mac and Win
- Flowchart | Basic Flowchart Symbols and Meaning
- Flowchart | Flowchart Design - Symbols, Shapes, Stencils and Icons
- Flowchart | Flow Chart Symbols
- Electrical | Electrical Drawing - Wiring and Circuits Schematics
- Flowchart | Common Flowchart Symbols
- Flowchart | Common Flowchart Symbols