 Stakeholder Onion Diagrams
The Stakeholder Onion Diagram is often used as a way to view the relationships of stakeholders to a project goal. A basic Onion Diagram contains a rich information. It shows significance of stakeholders that will have has influence to the success achieve
Stakeholder Onion Diagrams

Design fast and easy Stakeholder Onion Diagrams of any complexity in ConceptDraw PRO diagramming and vector drawing software using the powerful tools of Stakeholder Onion Diagrams Solution from the Management Area of ConceptDraw Solution Park.
HelpDesk
How to Create a Stakeholder Onion Diagram Using ConceptDraw PRO

Onion Diagram Templates

Design of Onion Diagrams and Stakeholder Onions Diagrams is a complex process, but ConceptDraw PRO diagramming and vector drawing software makes it easier thanks to the Stakeholder Onion Diagrams Solution from the Management Area of ConceptDraw Solution Park, and the set of included libraries and Onion Diagram templates.
Stakeholder Management System

ConceptDraw PRO is a powerful diagramming and vector drawing software. Now, thanks to the Stakeholder Onion Diagrams Solution included to the Management Area of ConceptDraw Solution Park, ConceptDraw PRO became also unique stakeholder management system design software.
How To Create Onion Diagram

But how to create Onion Diagram? Now, it's very easy thanks to the ConceptDraw PRO diagramming and vector drawing software extended with Stakeholder Onion Diagrams Solution from the Management Area of ConceptDraw Solution Park.
Onion Diagram Maker

ConceptDraw PRO diagramming and vector drawing software extended with Stakeholder Onion Diagrams Solution from the Management Area of ConceptDraw Solution Park is a professional Onion Diagram Maker.
Stakeholder Onion Diagram Template

Onion Diagram Process Design

ConceptDraw PRO diagramming and vector drawing software supplied with Stakeholder Onion Diagrams Solution from the Management Area of ConceptDraw Solution Park is an ideal software for effective Onion diagram process design.
Visualize Stakeholder Analysis

Use the ConceptDraw PRO diagramming and vector drawing software enhanced with powerful tools of Stakeholder Onion Diagrams Solution from the Management Area of ConceptDraw Solution Park to easy and effectively visualize stakeholder analysis.
Stakeholder Mapping Tool

ConceptDraw PRO diagramming and vector drawing software extended with Stakeholder Onion Diagrams Solution from the Management Area of ConceptDraw Solution Park is a powerful stakeholder mapping tool which allows easy create Stakeholder Onion diagrams and maps depicting the layers of a project, relationships of stakeholders to a project goal, and relationships between stakeholders.
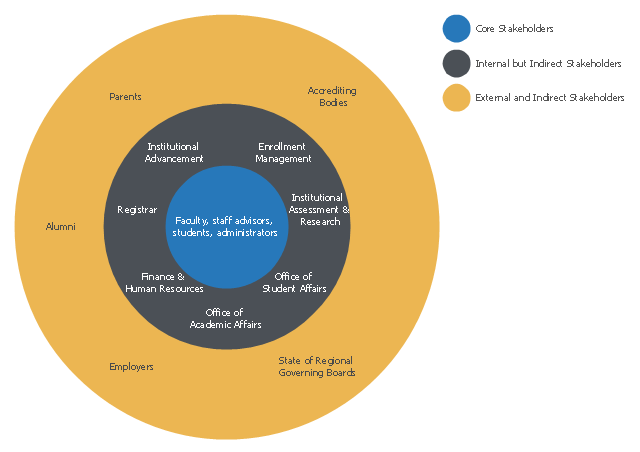
This onion diagram example was designed on the base of figure "Academic advising stakeholder framework" in the article "Defining Advising Stakeholder Groups" by Julianne Messia from the website of NACADA Executive Office,
Kansas State University.
"A complete stakeholder analysis, therefore, not only names the stakeholders but accurately characterizes each stakeholder’s power and influence.
Harney (2008) identified advising stakeholders as being either internal or external constituents. Stakeholders belong in one of three distinct classifications: (1) internal core stakeholders, (2) internal but indirect stakeholders, and (3) external and indirect stakeholders. The chart below (Figure 1) depicts these groups in a diagram representing their various levels of input, influence, and involvement; the closer a group is to the “core” the more investment and weight that group has in advising. The groups utilized in this specific example assume a shared model of advising (both faculty and advising professionals have advising responsibilities). As each institution has its own unique culture and advising model, the chart should be adapted for any program or institution. For instance, an institution with a centralized advising model may list faculty as Internal but Indirect Stakeholders as they do not provide or administer advising directly."
[nacada.ksu.edu/ Resources/ Clearinghouse/ View-Articles/ Defining-Advising-Stakeholder-Groups.aspx]
The onion diagram example "Stakeholder diagram" was drawn using the ConceptDraw PRO software extended with the Stakeholder Onion Diagrams solution from the Management area of ConceptDraw Solution Park.
Onion diagram example
TQM Software — Build Professional TQM Diagrams

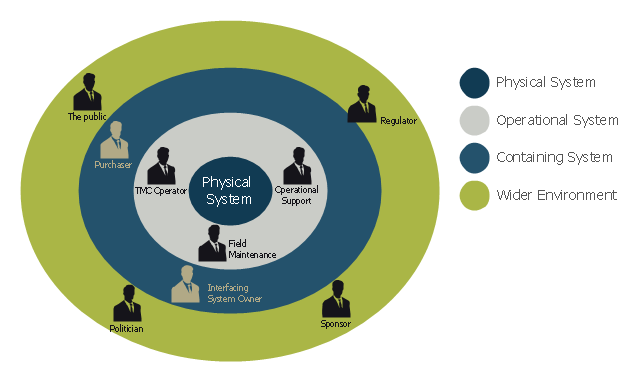
This onion diagram example was designed on the base of figure "Stakeholders for a System" in the slide presentation "A103: Introduction to ITS Standards Requirements Development" from the U.S. Department of Transportation (US DOT) website.
"“Stakeholders for a System.” A graphic of four concentric circles arranged like an archery target. The innermost circle is a reddish tan. The three bands of colors that are further from the center are in lighter shades of tan. This is called an “onion diagram” as onions are made up of multiple layers. The inner circle is labeled “Physical System.” The next layer outward is labeled “Operational System.” The next layer outward is labeled “Containing System.” The outermost layer is labeled “Wider Environment.” There are smaller black graphics of person positioned in the different layers of the diagram. Each person has a project role next to it as follows: 1) Inner Circle has no people – It represents the system; 2) Next Layer Outward has three people labeled TMC Operator, Field Maintenance, and Operational Support respectively; 3) Next Layer Outward has two people labeled Interfacing System Owner and Purchaser respectively; and 4) Outermost Layer has four people labeled Sponsor of the Project, Regulatory Agency, Public, and Politician respectively. The picture demonstrates while they are all stakeholders, different stakeholders have different levels of influence on the physical system to be defined. The most influence coming from those closest to the center."
[pcb.its.dot.gov/ standardstraining/ mod04/ ppt/ m04ppt.htm]
The onion diagram example "System stakeholders diagram" was drawn using the ConceptDraw PRO software extended with the Stakeholder Onion Diagrams solution from the Management area of ConceptDraw Solution Park.
Onion diagram example
- Management Stakeholder Onion Diagrams
- Project Management Area | Stakeholder Onion Diagrams | Types of ...
- Stakeholder Onion Diagrams
- Successful Strategic Plan | Management Consultant | Stakeholder ...
- Stakeholder Mapping Tool | Circle Spoke Diagram Template ...
- Stakeholder Management System | Onion Diagram Maker ...
- How To Create Onion Diagram | Stakeholder Onion Diagrams ...
- Stakeholder Management System | How To Create Onion Diagram ...
- How To Create Onion Diagram | Stakeholder Onion Diagrams ...
- Competitor Analysis | Stakeholder Onion Diagrams | Process ...
- Stakeholder Onion Diagram Template
- Health club floor plan | Stakeholder Onion Diagrams | Business ...
- Research onion diagram | Stakeholder Onion Diagrams | How To ...
- Stakeholder Onion Diagrams | Circle-Spoke Diagrams ...
- How To Create Onion Diagram | Onion Diagram Process Design ...
- Organizational Structure Diagram Software | How To Create Onion ...
- Pyramid Diagram | Stakeholder Onion Diagrams | 4 Layers Of The ...
- Stakeholder Onion Diagrams | How To Create Onion Diagram | How ...
- SWOT and TOWS Matrix Diagrams | Stakeholder Onion Diagrams ...
- Timeline diagram | Stakeholder Onion Diagram Template | | Project ...
- ERD | Entity Relationship Diagrams, ERD Software for Mac and Win
- Flowchart | Basic Flowchart Symbols and Meaning
- Flowchart | Flowchart Design - Symbols, Shapes, Stencils and Icons
- Flowchart | Flow Chart Symbols
- Electrical | Electrical Drawing - Wiring and Circuits Schematics
- Flowchart | Common Flowchart Symbols
- Flowchart | Common Flowchart Symbols