 Bar Graphs
The Bar Graphs solution enhances ConceptDraw PRO v10 functionality with templates, numerous professional-looking samples, and a library of vector stencils for drawing different types of Bar Graphs, such as Simple Bar Graph, Double Bar Graph, Divided Bar Graph, Horizontal Bar Graph, Vertical Bar Graph, and Column Bar Chart.
Bar Graph

HelpDesk
How to Create a Bar Chart in ConceptDraw PRO

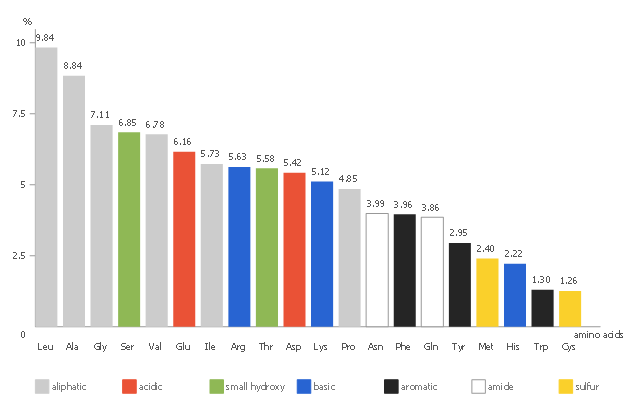
Bar charts are widely used to show and compare the values of the same parameters for different data groups.
The bar graph can be vertical or horizontal. This depends on the amount of categories. There are many methods in which bar graph can be built and this makes it a very often used chart type. Usually, a bar chart is created so that the bars are placed vertically. Such arrangement means that the bar's height value is proportional to the category value. Nevertheless, a bar chart can be also drawn horizontally. This means that the longer the bar, the bigger the category. Thus, a bar chart is a good way to present the relative values of different measured items. The ConceptDraw Bar Graphs solution allows you to draw a bar chart quickly using a vector library, containing the set of various bar charts objects.
This pictorial bar chart sample was redesigned from the Wikimedia Commons file: Barrie Population.jpg.
[commons.wikimedia.org/ wiki/ File:Barrie_ Population.jpg]
"Barrie is a city in Central Ontario, Canada, on the western shore of Lake Simcoe. Although located in Simcoe County, the city is politically independent. Barrie is within the northern part of the Greater Golden Horseshoe, a densely populated and industrialized region of Ontario.
In 2011 census, the city's population was originally reported as 135,711, making it the 34th largest in Canada. The city's 2011 population was subsequently revised to 136,063. The Barrie census metropolitan area (CMA) had a population of 187,013 residents, making it the 21st largest CMA in Canada." [Barrie. Wikipedia]
The picture bar graph example "Barrie population" was created using the ConceptDraw PRO diagramming and vector drawing software extended with the Picture Graphs solution from the Graphs and Charts area of ConceptDraw Solution Park.
Picture bar graph

Bar Chart Software

How to Create a Line Chart

Bar Diagrams for Problem Solving. Create event management bar charts with Bar Graphs Solution

"Bar graphs can ... be used for more complex comparisons of data with grouped bar charts and stacked bar charts. In a grouped bar chart, for each categorical group there are two or more bars. These bars are color-coded to represent a particular grouping. For example, a business owner with two stores might make a grouped bar chart with different colored bars to represent each store: the horizontal axis would show the months of the year and the vertical axis would show the revenue. Alternatively, a stacked bar chart could be used. The stacked bar chart stacks bars that represent different groups on top of each other. The height of the resulting bar shows the combined result of the groups. However, stacked bar charts are not suited to datasets where some groups have negative values. In such cases, grouped bar charts are preferable." [Bar chart. Wikipedia]
The double bar graph template for the ConceptDraw PRO diagramming and vector drawing software is included in the Bar Graphs solution from the Graphs and Charts area of ConceptDraw Solution Park.
The double bar graph template for the ConceptDraw PRO diagramming and vector drawing software is included in the Bar Graphs solution from the Graphs and Charts area of ConceptDraw Solution Park.
Two series column chart template
Bar Diagram Math

HelpDesk
How to Draw a Divided Bar Chart in ConceptDraw PRO

Bar Charts

Making a Histogram

Bar Chart

How Do You Make a Histogram?

How To Make Histogram in ConceptDraw PRO?

- Bar Chart Software | Histogram Chart | Making a Histogram ...
- Histogram Chart | Making a Histogram | Histogram | Bar Graph Vs ...
- Sales Growth. Bar Graphs Example | Bar Chart Examples | Financial ...
- How to Create a Picture Graph in ConceptDraw PRO | How to ...
- Sales Growth. Bar Graphs Example | Bar Diagrams for Problem ...
- Bar Graph | Mechanical Engineering | How To Make A Stacked Bar ...
- Bar Graph | Basketball | How To Make Stacked Bar Graph
- ATM UML Diagrams | State Machine Diagram | Bar Graphs | Atm ...
- Bar Graph
- Bar Graphs On Sports
- Barrie population - Picture bar graph | Picture graphs - Vector ...
- Create Graphs and Charts | Sales Growth. Bar Graphs Example ...
- Bar Graph | Bar Graphs | Bar Chart Software | _bar Graph_
- Barrie population - Picture bar graph | Design elements - Picture ...
- Bar Graphs | Line Graphs | Picture Graphs | Graphs
- Bar Graphs | Double bar graph - Template | Nitrate concentration in ...
- Sales Growth. Bar Graphs Example | How to Create a Picture Graph ...
- Create Graphs and Charts | Making a Histogram | Histogram ...
- Picture Graphs | How to Create a Picture Graph in ConceptDraw ...
- Basic Diagramming | Picture Graph | Pictures of Graphs | Bar Graph ...
- ERD | Entity Relationship Diagrams, ERD Software for Mac and Win
- Flowchart | Basic Flowchart Symbols and Meaning
- Flowchart | Flowchart Design - Symbols, Shapes, Stencils and Icons
- Flowchart | Flow Chart Symbols
- Electrical | Electrical Drawing - Wiring and Circuits Schematics
- Flowchart | Common Flowchart Symbols
- Flowchart | Common Flowchart Symbols