This site uses cookies. By continuing to browse the ConceptDraw site you are agreeing to our Use of Site Cookies.

ConceptDraw Solution Park ConceptDraw Solution Park

ConceptDraw Solution Park
ConceptDraw Solution Park collects graphic extensions, examples and learning materials
HelpDesk

How to Create a Timeline Diagram in ConceptDraw PRO

A Timeline is a chart which displays a project plan schedule in chronological order. A Timeline is used in project management to depict project milestones and visualize project phases, and show project progress. The graphic form of a timeline makes it easy to understand critical project milestones, such as the progress of a project schedule. Timelines are particularly useful for project scheduling or project management when accompanied with a Gantt chart. It captures the main of what the project will accomplish and how it will be done. making a project timeline is one of the most important skills a project manager needs have. Making comprehensive, accurate timelines allows you getting every project off in the best way. ConceptDraw PRO allows you to draw a timeline charts using special library.
HelpDesk

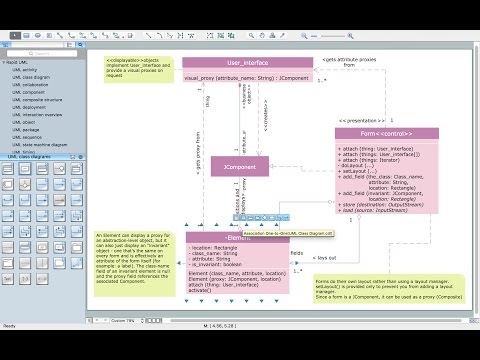
How to Make a UML Diagram in ConceptDraw PRO

The Unified Modeling Language™(UML) is a standard visual modeling language to document business processes and software architecture. UML uses several types of diagrams including Use Case Diagrams, Class, Package, Component, Composite Structure Diagrams, Deployments, Activities and Interactions. The accepted standard used when modeling a system is known as Unified Modeling Language (UML), a generic set of notations that are used when creating UML diagrams. These notations can visually represent requirements, subsystems, logical and physical elements, and structural and behavioral patterns, that are especially relevant to systems built using an object-oriented style.
Using UML during the modeling process has a number of benefits — for one, the entire development team can share information and collaborate using common language, diagrams and software, something that's not possible when using a more task-specific programming language.
It allows team members to create system 'blueprin
HelpDesk

How to Make a Basketball Court Diagram

Basketball Court diagrams is often used as a teaching and learning tool for coaches, players and parents to describe the basketball moves and shooting drills. The ability to create Basketball diagrams with ConceptDraw PRO is contained in the Basketball solution. It provides a set of special tools for creating different Basketball diagrams. Basketball court diagram is used to describe basketball moves and shooting drills during the discussion of the match, as well as to develop a winning defense and attack strategy as a clear visual plans for future games.
HelpDesk

How to Create a Hook Up Diagram

Hook-up diagram of audio-video system is a detailed drawing showing the audio video connections in a correct manner so that system operates properly. Using the hook up diagram you can understand how the elements of your audio-video system should be installed. ConceptDraw PRO allows you to draw the Hook Up diagram of Audio-Video system easily using the set of special libraries provided by Audio and Video Connectors solution.
HelpDesk

How To Create a PERT Chart

Project Evaluation and Review Technique (PERT) is a method of project tasks evaluation and analysis. PERT - is a method of analyzing the tasks required to complete the project. It includes analysis of the time required to complete each task, as well as the determination of the time required to carry out the whole project. PERT was developed to facilitate the planning of huge and complex projects. PERT is used for very large, complex, and non-standard projects. Technology implies the presence of uncertainty, making it possible to develop a schedule of the project without a precise information on details and time required for all of its components. The most popular part of PERT is a method of the critical path, based on the construction of the network schedule (PERT network diagram). ConceptDraw Office delivers you the best way to create PERT chart for your project using compatibility between ConceptDraw PROJECT and ConceptDraw PRO.

entity-relationship diagram, ER-diagram, database ERD Entity-Relationship Diagram (ERD)

entity-relationship diagram, ER-diagram, database ERD
Entity-Relationship Diagram (ERD) solution extends ConceptDraw PRO software with templates, samples and libraries of vector stencils from drawing the ER-diagrams by Chen's and crow’s foot notations.
HelpDesk

How to Create a UML Diagram Using ConceptDraw PRO

ConceptDraw PRO is a perfect tool to draw UML Diagrams.
Rapid UML Solution
Rapid UML Solution
HelpDesk

How to Make Soccer Position Diagram Using ConceptDraw PRO

The soccer field has the form of a large rectangle, covered with grass. Dimensions of soccer fields may vary slightly, depending on the level of the game, but all fields have some common characteristics. Soccer players may take different positions. Each soccer position has its own name, and implies certain player functions. Every soccer position has a very specific name and task: Goalkeeper, Defenders, Midfielders and Forwards. During preparation for the game coach met a challenge: how to explain each player's position and his role in the game. The difficulty is the fact that in the course of the game players will often move on the field and do not stay in one place. Football field diagram with dimensions and marking, and positions - it is an important tool for the coach. ConceptDraw PRO helps both coach and players to understand exactly their roles during the particular game. The ability to create Soccer diagrams is contained in the ConceptDraw Soccer solution. The solution provides