How to draw Metro Map style infographics? Moscow, New York, Los Angeles, London

How to draw Metro Map style infographics? (London)

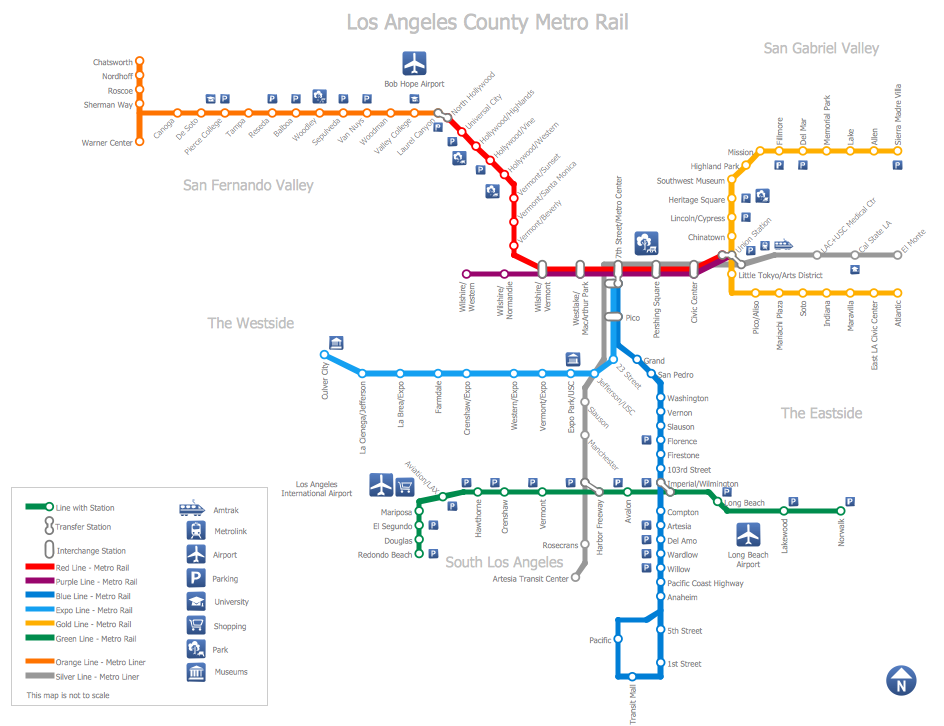
Metro Map
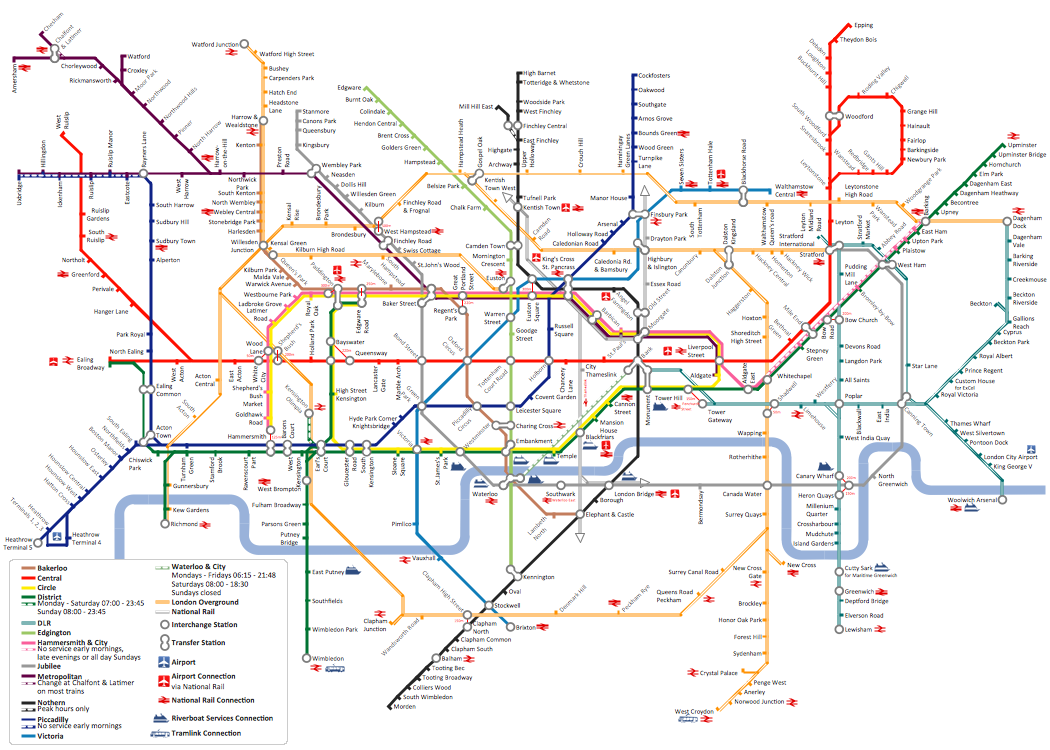
The Metro Map Solution from the Maps Area uses two ConceptDraw techniques: Replicating Objects and Switching Objects. And the result is a vector graphic document.
Geo Map - Canada - Ontario

The vector stencils library Ontario contains contours for ConceptDraw DIAGRAM diagramming and vector drawing software. This library is contained in the Continent Maps solution from Maps area of ConceptDraw Solution Park.
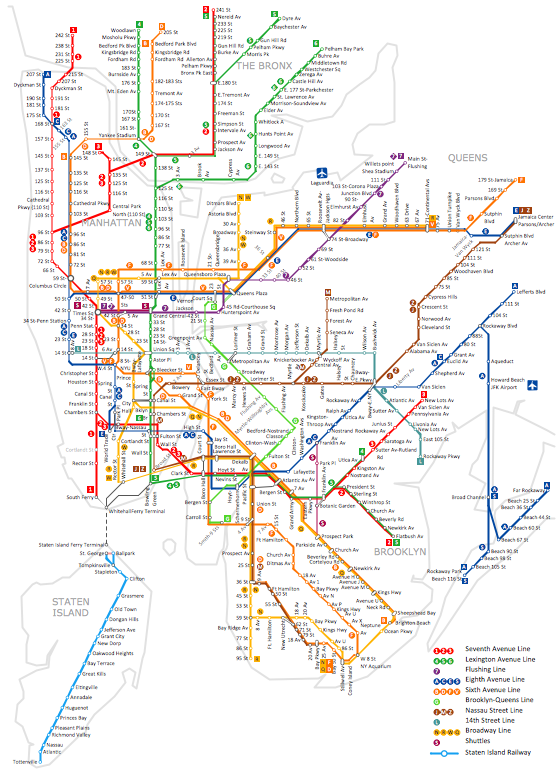
Infographic software: the sample of New York City Subway map
Geo Map - Canada - Quebec
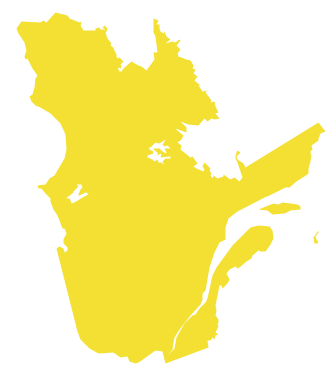
The vector stencils library Quebec contains contours for ConceptDraw DIAGRAM diagramming and vector drawing software. This library is contained in the Continent Maps solution from Maps area of ConceptDraw Solution Park.
Best Flowcharts

Conceptdraw DIAGRAM - feature-rich flowchart software. It will allow you to create professional looking flowcharts.
Map of UK — Great Britain Cities
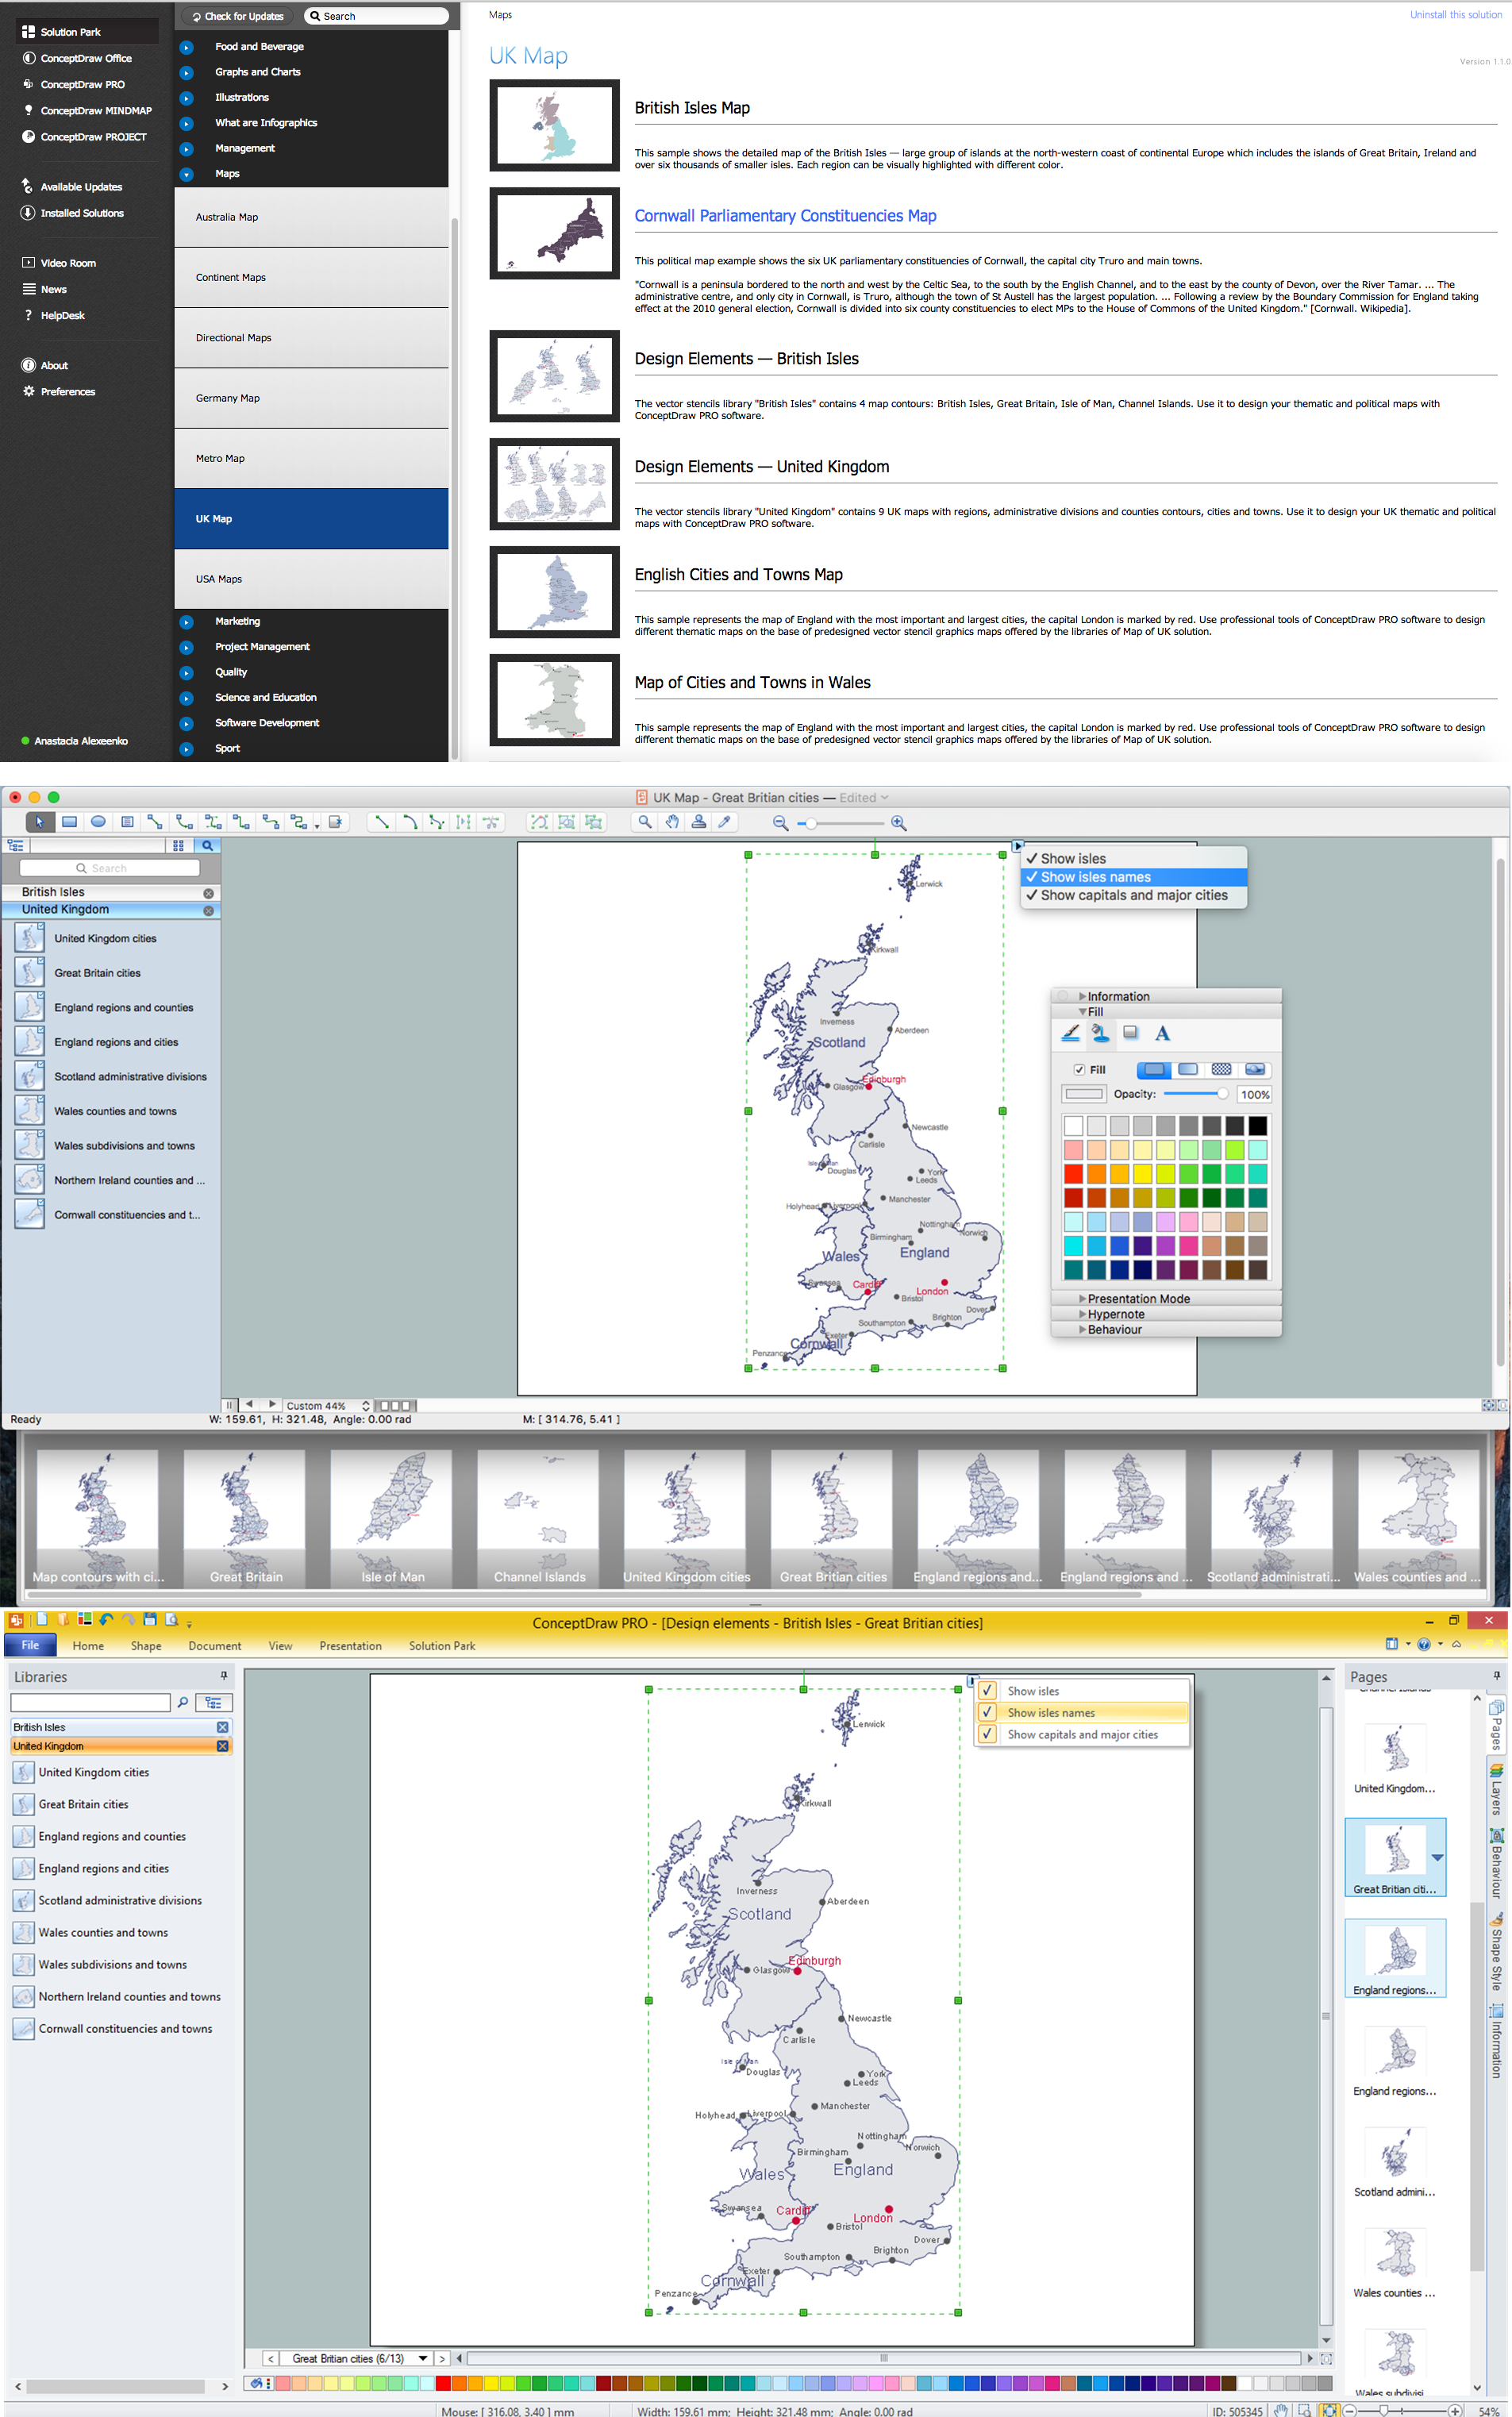
How to design the Map of UK fast and easy? It is incredibly convenient to use special software. ConceptDraw DIAGRAM diagramming and vector drawing software offers the Map of UK Solution from the Maps Area of ConceptDraw Solution Park specially developed to make easier drawing the maps of UK counties, various UK related thematic maps and cartograms on their base.
Best Tool for Infographic Construction

Subway Train Map
- London Tube Map Vector File
- London Underground Vector Graphic
- London Metro Map Vector Files
- London Tube Map Vector
- London Detailed Tube Map Vector
- Metro Map Vector Free
- London tube map | How to draw Metro Map style infographics ...
- Winter Sports Vector Clipart. Medal Map. Spatial Infographics | How ...
- How to draw Metro Map style infographics? ( London ) | How to draw ...
- Vector Map of Germany | Infographic design elements, software ...
- ERD | Entity Relationship Diagrams, ERD Software for Mac and Win
- Flowchart | Basic Flowchart Symbols and Meaning
- Flowchart | Flowchart Design - Symbols, Shapes, Stencils and Icons
- Flowchart | Flow Chart Symbols
- Electrical | Electrical Drawing - Wiring and Circuits Schematics
- Flowchart | Common Flowchart Symbols
- Flowchart | Common Flowchart Symbols