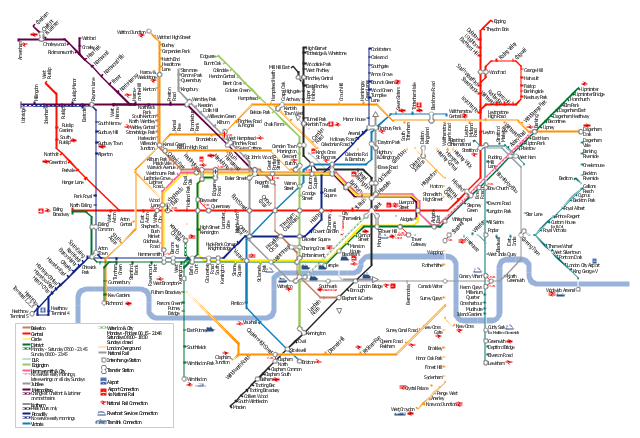
"The Tube map is a schematic transit map of the lines and stations of London's public rapid transit railway systems, namely the London Underground (commonly known as the Tube, hence the name), Docklands Light Railway, London Overground and Emirates Air Line, as well as being incorporated into Greater London connections maps.
As a schematic diagram, it shows not necessarily the geographic but rather the relative positions of stations along the lines, stations' connective relations with each other and fare zones. The basic design concepts have been widely adopted for other network maps around the world, especially that of mapping topologically rather than geographically." [Tube map. Wikipedia]
The transit map example "London tube map" was created using the ConceptDraw PRO diagramming and vector drawing software extended with the Metro Map solution from the Maps area of ConceptDraw Solution Park.
www.conceptdraw.com/ solution-park/ maps-metro-map
Explore the oldest underground in the world. Started in 1863, the London Tube today opens a new station inside ConceptDraw.
London tube map
How to draw Metro Map style infographics? Moscow, New York, Los Angeles, London

How to draw Metro Map style infographics? (London)

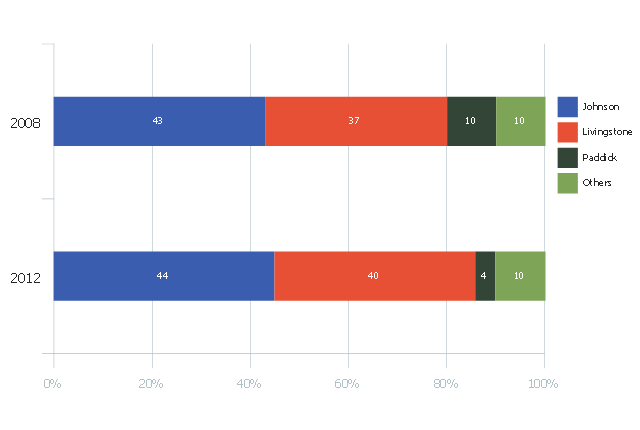
This divided bar chart sample was drawn on the base of the infographics "London Elections Results by Numbers" from the london.gov.uk website.
[data.london.gov.uk/ datastore/ package/ london-elections-results-2012-wards-boroughs-constituency]
"There are six types of elections in the United Kingdom: United Kingdom general elections, elections to devolved parliaments and assemblies, elections to the European Parliament, local elections, mayoral elections and Police and Crime Commissioner elections. Elections are held on Election Day, which is conventionally a Thursday. General elections do not have fixed dates, but must be called within five years of the opening of parliament following the last election. Other elections are held on fixed dates, though in the case of the devolved assemblies and parliaments early elections can occur in certain situations. Currently, six electoral systems are used: the single member plurality system (First Past the Post), the multi member plurality system, party list PR, the single transferable vote, the Additional Member System and the Supplementary Vote.
Elections are administered locally: in each lower-tier local authority, the actual polling procedure is run by the Returning Officer and the compiling and maintenance of the electoral roll by the Electoral Registration Officer (except in Northern Ireland, where the Electoral Office for Northern Ireland assumes both responsibilities). The Electoral Commission only sets standards for and issues guidelines to Returning Officers and Electoral Registration Officers, but is responsible for nationwide electoral administration (such as the registration of political parties and directing the administration of national referendums)." [Elections in the United Kingdom. Wikipedia]
The divided bar diagram example "London election results" was created using the ConceptDraw PRO diagramming and vector drawing software extended with the Divided Bar Diagrams solution from the Graphs and Charts area of ConceptDraw Solution Park.
Divided bar chart
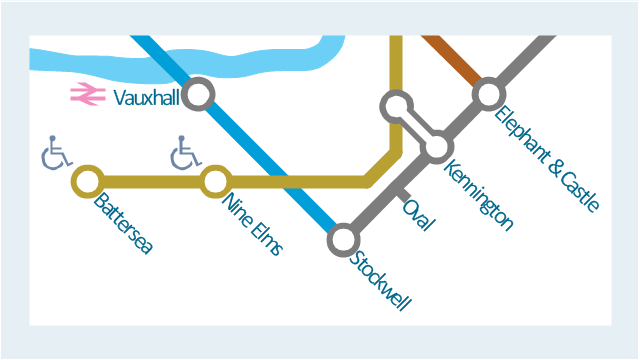
This spatial infographic example was created on the base of the tube map from the Transport for London website.
[tfl.gov.uk/ assets/ images/ general/ 24746-nle-gallery-tube-map.jpg]
"The Tube map is a schematic transit map of the lines and stations of London's public rapid transit railway systems, namely the London Underground (commonly known as the Tube, hence the name), Docklands Light Railway, London Overground and Emirates Air Line, as well as being incorporated into Greater London connections maps.
As a schematic diagram, it shows not necessarily the geographic but rather the relative positions of stations along the lines, stations' connective relations with each other and fare zones. The basic design concepts have been widely adopted for other network maps around the world, especially that of mapping topologically rather than geographically." [Tube map. Wikipedia]
The spatial infographics example "Metro map - Northern line extension to Battersea via Nine Elms" was created using the ConceptDraw PRO diagramming and vector drawing software extended with the Spatial Infographics solution from the area "What is Infographics" of ConceptDraw Solution Park.
Tube map
 Metro Map
Metro Map solution extends ConceptDraw PRO software with templates, samples and library of vector stencils for drawing the metro maps, route maps, bus and other transport schemes, or design tube-style infographics.
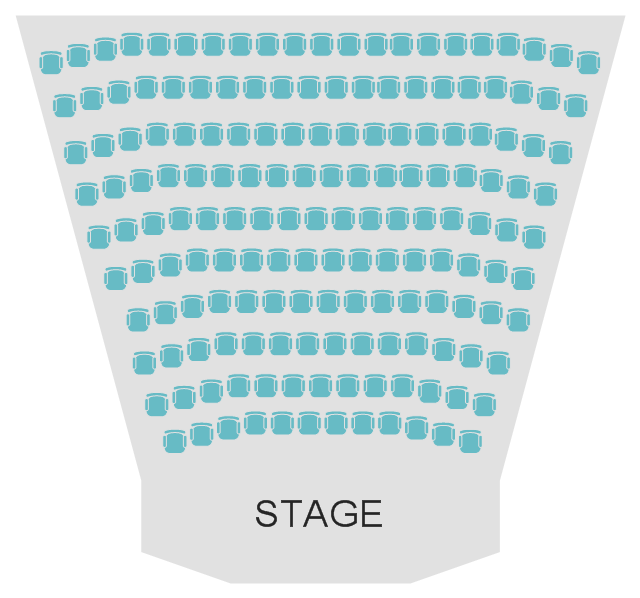
This seating plan sample shows the seat layout in the theater.
"A theater, theatre or playhouse, is a structure where theatrical works or plays are performed or other performances such as musical concerts may be produced. While a theater is not required for performance (as in environmental theater or street theater), a theater serves to define the performance and audience spaces. The facility is traditionally organized to provide support areas for performers, the technical crew and the audience members.
There are as many types of theaters as there are types of performance. Theaters may be built specifically for a certain types of productions, they may serve for more general performance needs or they may be adapted or converted for use as a theater. They may range from open-air amphitheaters to ornate, cathedral-like structures to simple, undecorated rooms or black box theaters. Some theaters may have a fixed acting area (in most theaters this is known as the stage), while some theaters such as black box theaters, may not, allowing the director and designers to construct an acting area suitable for the production.
In Australia and New Zealand a small and simple theater, particularly one contained within a larger venue, is called a theatrette. The word originated in 1920s London, for a small-scale music venue." [Theater (structure). Wikipedia]
"... theatres or cinemas may allow spectators to choose their seats beforehand. A seating plan is of crucial importance for musical ensembles or orchestras, where every type of instrument is allocated a specific section." [Seating plan. Wikipedia]
The seat layout example "Theater seating plan" was created using ConceptDraw PRO diagramming and vector drawing software extended with the Seating Plans solution from the Building Plans area of ConceptDraw Solution Park.
Seat layout
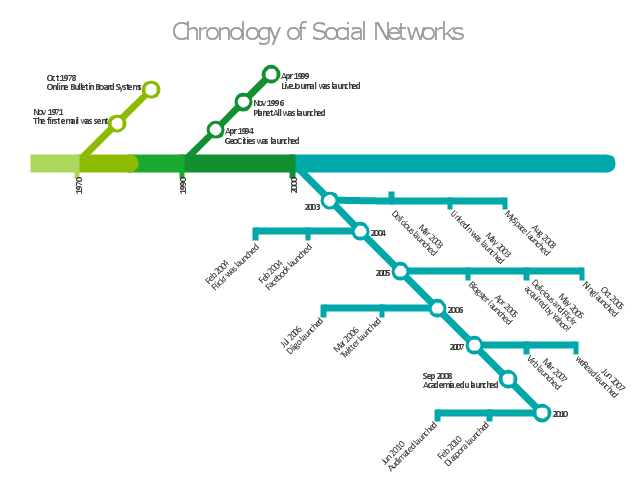
"There are a growing number of books, websites and works of art on the subject of urban rail and metro map design and use. There are now hundreds of examples of diagrams in an urban rail or metro map style that are used to represent everything from other transit networks like buses and national rail services to sewerage systems and Derbyshire public houses.
One of the most well-known adaptations of an urban rail map was The Great Bear by Simon Patterson. First shown in 1992 nominated for the Turner Prize The Great Bear replaces station names on the London Underground map with those of explorers, saints, film stars, philosophers and comedians. Other artists such as Scott Rosenbaum, and Ralph Gray have also taken the iconic style of the urban rail map and made new artistic creations ranging from the abstract to the solar system. Following the success of these the idea of adapting other urban rail and metro maps has spread so that now almost every major subway or rapid transit system with a map has been doctored with different names, often anagrams of the original station name." [Transit map. Wikipedia]
The infographics example "Chronology of social networks" was created using the ConceptDraw PRO diagramming and vector drawing software extended with the Metro Map solution from the Maps area of ConceptDraw Solution Park.
Infographics
Relative Value Chart Software

Relative values are widely used in:business, economics, investment, management, marketing, statistics, etc.
ConceptDraw PRO software is the best for drawing professional looking Relative Value Charts. ConceptDraw PRO provides Divided Bar Diagrams solution from the Graphs and Charts Area of ConceptDraw Solution Park.
 Divided Bar Diagrams
The Divided Bar Diagrams Solution extends the capabilities of ConceptDraw PRO v10 with templates, samples, and a library of vector stencils for drawing high impact and professional Divided Bar Diagrams and Graphs, Bar Diagram Math, and Stacked Graph.
 Spatial Infographics
Spatial infographics solution extends ConceptDraw PRO software with infographic samples, map templates and vector stencils libraries with design elements for drawing spatial information graphics.
- How to draw Metro Map style infographics? ( London ) | London tube ...
- London tube map | How to draw Metro Map style infographics ...
- How to draw Metro Map style infographics? ( London ) | Infographic ...
- How to draw Metro Map style infographics? ( London ) | Metro Map ...
- How to draw Metro Map style infographics? ( London ) | How to draw ...
- How to draw Metro Map style infographics? ( London ) | How to draw ...
- Metro Map | How to draw Metro Map style infographics? ( London ...
- How to draw Metro Map style infographics? ( London ) | London tube ...
- Metro Map | How to draw Metro Map style infographics? ( London ...
- How to draw Metro Map style infographics? ( London ) | How to draw ...
- London tube map - Conceptdraw.com
- How to draw Metro Map style infographics? ( London ) | How to draw ...
- Maps | How to draw Metro Map style infographics? ( London ) | How ...
- London tube map | Design elements - Cable TV (CATV) | Transport ...
- Divided bar diagram - London election results | Divided bar diagram ...
- Divided bar diagram - London election results | Relative Value Chart ...
- Divided bar diagram - London election results |
- How to draw Metro Map style infographics? ( London ) | Value Stream ...
- How to draw Metro Map style infographics? ( London )
- Exploded pie chart - European Parliament election | Divided bar ...
- ERD | Entity Relationship Diagrams, ERD Software for Mac and Win
- Flowchart | Basic Flowchart Symbols and Meaning
- Flowchart | Flowchart Design - Symbols, Shapes, Stencils and Icons
- Flowchart | Flow Chart Symbols
- Electrical | Electrical Drawing - Wiring and Circuits Schematics
- Flowchart | Common Flowchart Symbols
- Flowchart | Common Flowchart Symbols