Data Flow Diagram Software

ConceptDraw DIAGRAM is a powerful Data Flow Diagram Software thanks to the Data Flow Diagrams solution from the Software Development area of ConceptDraw Solution Park.
You can use the predesigned DFD vector objects that are grouped in 3 libraries of Data Flow Diagrams solution: Data Flow Diagrams Library; Gane-Sarson Notation Library; Yourdon and Coad Notation Library.
IDEF3 Standard

Functional Flow Block Diagram

Symboles Organigramme

Voir aussi d'autres symboles organigramme: Symboles ordinogramme standard, symboles du flux de travail, Vérification Les symboles du schéma fonctionnel, sOrganigramme comptables des symboles, Organigramme de vente des symboles, Symboles pour organigramme des RH, Carte des symboles de processus, Diagramme de processus opérationnels, Symboles utilisés dans le schéma IDEF0.
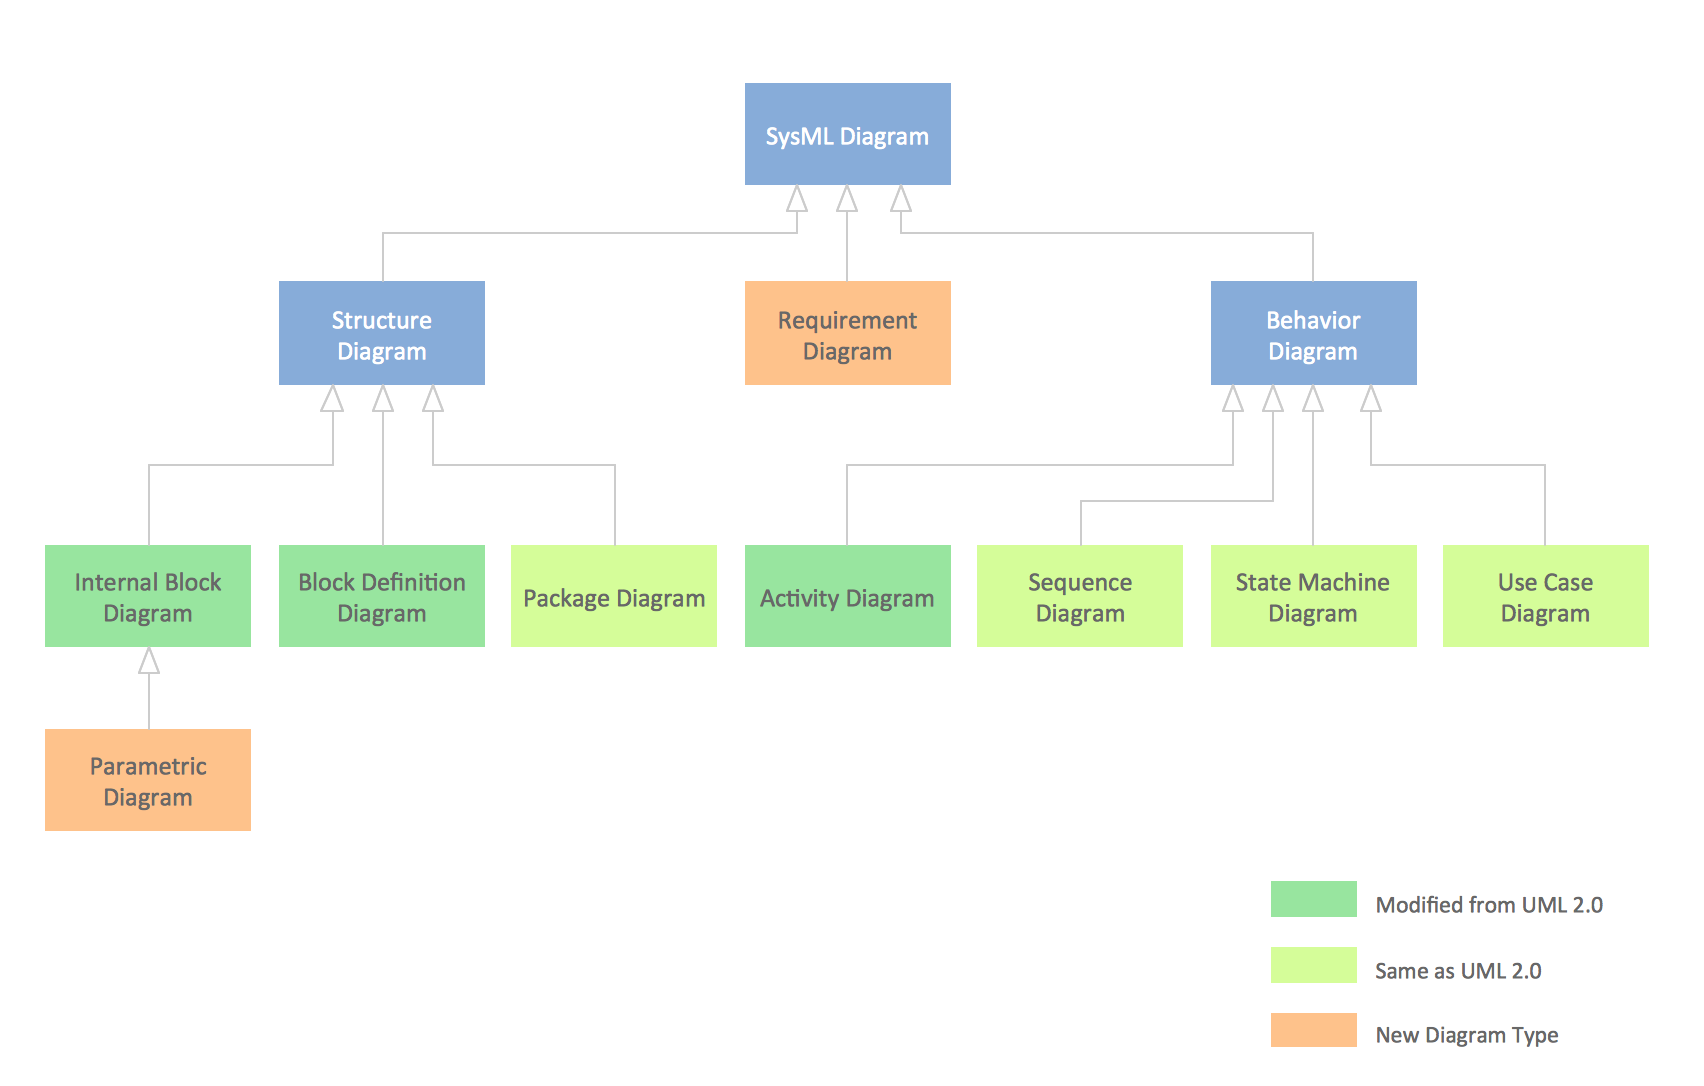
SysML Diagram
Best Value Stream Mapping mac Software

Data structure diagram with ConceptDraw DIAGRAM

ConceptDraw DIAGRAM ER Diagram Tool

ConceptDraw ER Diagram Tool works across any platform, meaning you never have to worry about compatibility again. ConceptDraw DIAGRAM allows you to make Entity-Relationship Diagram (ERD) on PC or macOS operating systems.
Stakeholder Mapping Tool

ConceptDraw DIAGRAM diagramming and vector drawing software extended with Stakeholder Onion Diagrams Solution from the Management Area of ConceptDraw Solution Park is a powerful stakeholder mapping tool which allows easy create Stakeholder Onion diagrams and maps depicting the layers of a project, relationships of stakeholders to a project goal, and relationships between stakeholders.
- Chemical Engineering Process Flow Diagram Software Free
- Logiciel Flowchart
- SysML Diagram | Diagramming Software for Design UML ...
- Symboles Organigramme | Logiciel Organigramme Gratuit
- Conceptdraw.com: Mind Map Software , Drawing Tools | Project ...
- Audio and Video Interfaces and Connectors | Audio Visual ...
- Audio, Video, Media | Audio and Video Connections Explained ...
- Audio, Video, Media | Android User Interface | Audio - Vector ...
- Hook up diagram - Stereo audio/visual entertainment system ...
- Design elements - Android system icons (av) | Design elements ...
- ERD | Entity Relationship Diagrams, ERD Software for Mac and Win
- Flowchart | Basic Flowchart Symbols and Meaning
- Flowchart | Flowchart Design - Symbols, Shapes, Stencils and Icons
- Flowchart | Flow Chart Symbols
- Electrical | Electrical Drawing - Wiring and Circuits Schematics
- Flowchart | Common Flowchart Symbols
- Flowchart | Common Flowchart Symbols