HelpDesk
How to Make Network Diagram

HelpDesk
How to Create a Rack Diagram in ConceptDraw PRO

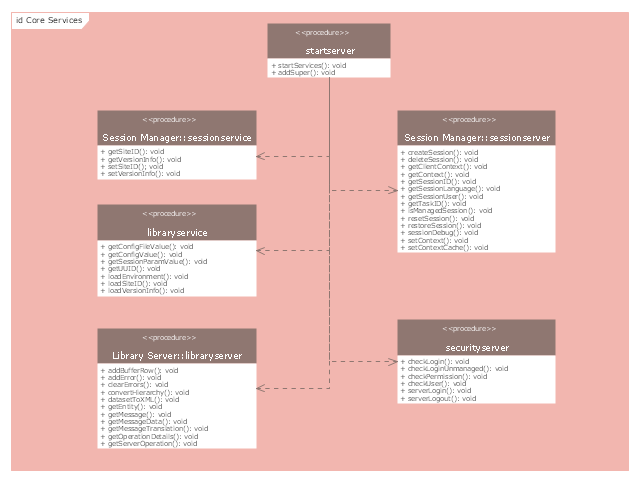
"A server is a system (software and suitable computer hardware) that responds to requests across a computer network to provide, or help to provide, a network service. Servers can be run on a dedicated computer, which is also often referred to as "the server", but many networked computers are capable of hosting servers. In many cases, a computer can provide several services and have several servers running.
Servers operate within a client-server architecture. Servers are computer programs running to serve the requests of other programs, the clients. Thus, the server performs some tasks on behalf of clients. The clients typically connect to the server through the network but may run on the same computer. In the context of Internet Protocol (IP) networking, a server is a program that operates as a socket listener.
Servers often provide essential services across a network, either to private users inside a large organization or to public users via the Internet. Typical computing servers are database server, file server, mail server, print server, web server, gaming server, application server, or some other kind of server.
Numerous systems use this client / server networking model including Web sites and email services. An alternative model, peer-to-peer networking enables all computers to act as either a server or client as needed." [Server (computing). Wikipedia]
The UML component diagram example "Start server" was created using the ConceptDraw PRO diagramming and vector drawing software extended with the Rapid UML solution from the Software Development area of ConceptDraw Solution Park.
UML component diagram
"Chen's notation for entity–relationship modeling uses rectangles to represent entity sets, and diamonds to represent relationships appropriate for first-class objects: they can have attributes and relationships of their own. If an entity set participates in a relationship set, they are connected with a line.
Attributes are drawn as ovals and are connected with a line to exactly one entity or relationship set.
Cardinality constraints are expressed as follows:
- a double line indicates a participation constraint, totality or surjectivity: all entities in the entity set must participate in at least one relationship in the relationship set;
- an arrow from entity set to relationship set indicates a key constraint, i.e. injectivity: each entity of the entity set can participate in at most one relationship in the relationship set;
- a thick line indicates both, i.e. bijectivity: each entity in the entity set is involved in exactly one relationship.
- an underlined name of an attribute indicates that it is a key: two different entities or relationships with this attribute always have different values for this attribute.
Attributes are often omitted as they can clutter up a diagram; other diagram techniques often list entity attributes within the rectangles drawn for entity sets." [Entity–relationship model. Wikipedia]
The vector stencils library ERD, Chen's notation contains 13 symbols for drawing entity-relatinship diagrams using the ConceptDraw PRO diagramming and vector drawing software.
The example "Design elements - ER diagram (Chen notation)" is included in the Entity-Relationship Diagram (ERD) solution from the Software Development area of ConceptDraw Solution Park.
Chen's ERD
.png--diagram-flowchart-example.png)
HelpDesk
How to Resize Objects Disproportionately in ConceptDraw PRO

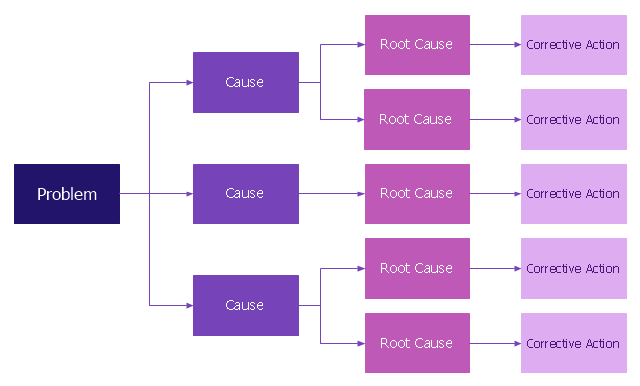
Root cause analysis (RCA) tree diagram lets identify the root causes for a factor and then list possible corrective action. The diagram displays the structure of causes for a factor and possible corrective actions. The root cause analysis tree diagram is used for further formulation of actions.
"Tree Diagram.
This tool is used to break down broad categories into finer and finer levels of detail. It can map levels of details of tasks that are required to accomplish a goal or solution or task. Developing the tree diagram helps one move their thinking from generalities to specifics." [Seven Management and Planning Tools. Wikipedia]
This root cause analysis tree diagram template for the ConceptDraw PRO diagramming and vector drawing software is included in the Seven Management and Planning Tools solution from the Management area of ConceptDraw Solution Park.
RCA diagram
IDEF3 Standard

HelpDesk
How to Create an AWS Architecture Diagram

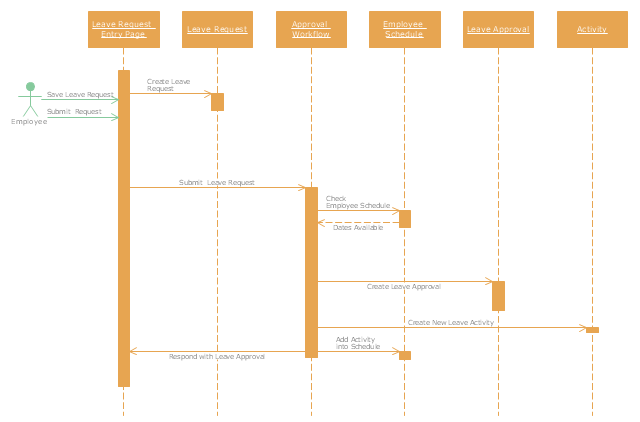
"A schedule or timetable is a basic time management tool consisting of a list of times at which possible tasks, events, or actions are intended to take place, or a sequence of events in the chronological order in which such things are intended to take place. The process of creating a schedule - deciding how to order these tasks and how to commit resources between the variety of possible tasks - is called scheduling, and a person responsible for making a particular schedule may be called a scheduler. Making and following schedules is a fundamental human activity, and learning to do these things effectively is one of the most basic life skills. There are a wide variety of situations in which schedules are necessary, or at least useful.
Schedules are useful for both short periods, such as a daily or weekly schedule, and for long term planning with respect to periods of several months or years. They are often made using a calendar, where the person making the schedule can note the dates and times at which various events are planned to occur. Schedules that do not set forth specific times for events to occur may instead list an expected order in which events either can or must take place." [Schedule. Wikipedia]
The UML sequence diagram example "Checking process" was created using the ConceptDraw PRO diagramming and vector drawing software extended with the Rapid UML solution from the Software Development area of ConceptDraw Solution Park.
UML sequence diagram
Network Diagram Software

Create computer network designs, diagrams and schematics using ConceptDraw.

HelpDesk
How to Make Soccer Position Diagram Using ConceptDraw PRO

- UML Diagrams with ConceptDraw PRO | UML Diagram Types List ...
- UML Tool & UML Diagram Examples | UML Diagram Types List ...
- UML Diagram Types List | UML Diagrams with ConceptDraw PRO ...
- UML Diagram Types List | Customer types matrix diagram | UML
- UML Diagram Types List | UML Diagram Types | UML Diagrams with
- UML Diagram Types List | Bubble diagrams in Landscape Design ...
- UML Diagram Types List | UML Notation | UML Diagrams with ...
- Computer Networking Tools List | Cisco network diagram template ...
- UML Diagram Types List | UML Component Diagram | UML Software |
- UML Diagram | UML Diagram Types List | UML for Software ...
- UML Notation | UML Diagram Types List | Software and Database ...
- 5 level pyramid model diagram of information systems types ...
- Root cause analysis tree diagram
- UML Class Diagram Example for Transport System
- UML Notation | UML Component Diagram | Diagramming Software ...
- UML Collaboration Diagram
- UML Notation | Business Process Modeling with ConceptDraw ...
- ERD Symbols and Meanings | Design elements - ER diagram (Chen ...
- Communication Diagram UML2.0 / Collaboration UML1.x ...
- Design elements - Rapid UML solution (component diagram ...
- ERD | Entity Relationship Diagrams, ERD Software for Mac and Win
- Flowchart | Basic Flowchart Symbols and Meaning
- Flowchart | Flowchart Design - Symbols, Shapes, Stencils and Icons
- Flowchart | Flow Chart Symbols
- Electrical | Electrical Drawing - Wiring and Circuits Schematics
- Flowchart | Common Flowchart Symbols
- Flowchart | Common Flowchart Symbols