COM and OLE Diagram
")
HelpDesk
How to Create a Concept Map in ConceptDraw PRO

HelpDesk
How to Connect Text Data to a Time Series Chart on Your Live Dashboard


This cycle diagram sample was created on the base of the figure illustrating the article "Environmental Materials" by Cris Arnold from the website of the UK Centre for Materials Education of the Higher Education Academy. "The figure ... schematically shows how the disparate areas under the heading of 'environmental materials' can be linked via a life cycle analysis approach. ...
Life Cycle Analysis.
Life Cycle Analysis is essentially a method of considering the entire environmental impact, energy and resource usage of a material or product. It is often known as a 'cradle-to-grave' analysis and can encompass the entire lifetime from extraction to end-of-life disposal. Life cycle analysis can be an extremely effective way of linking many different aspects of the environmental impacts of materials usage. ...
Materials Extraction and Resource Implications.
The environmental impact of raw materials extraction and processing together with global resource issues provides a good place to start consideration of environmental aspects of materials. ...
Environmental Impacts of Processing.
... Topics that would come under this subject area include the specific environmental problems associated with processing of metals, polymers, ceramics, composites etc, and how these problems can be overcome.
Design for Sustainability.
This area ... will ... cover issues such as design for successful recycling, waste minimisation, energy efficiency and increased lifetime.
Economic, Social and Legislative Issues.
... For example, materials selection within the automotive industry is now heavily influenced by 'end-of-life vehicle' and 'hazardous material' regulations.
Use of Sustainable Materials.
... It is probably sensible to define such materials as those that have distinct differences that achieve environmental benefit compared to conventional materials. With this definition, the list would include:
(1) Materials of a significantly plant-based nature, including wood, natural fibre composites, natural polymers.
(2) Materials produced using a large proportion of waste material, including recycled polymers, composites made from waste mineral powders, and arguably also much steel and aluminium.
Materials for Green Energy.
The most exciting developments in Materials Science are in the realm of functional materials, and many of these serve an environmentally-beneficial purpose, particularly in the production of green energy.
These include:
(1) Solar-cell materials.
(2) Fuel-cell technology.
(3) Catalytic pollution control.
End-of-Life Issues.
The treatment of materials at the end of their lifetime is a significant subject area and encompasses aspects such as recycling techniques and materials limitations, biodegradabilty and composting, chemical recovery and energy recovery." [materials.ac.uk/ guides/ environmental.asp]
The ring chart example "Life cycle analysis" was created using the ConceptDraw PRO diagramming and vector drawing software extended with the Target and Circular Diagrams solution from the Marketing area of ConceptDraw Solution Park.
www.conceptdraw.com/ solution-park/ marketing-target-and-circular-diagrams
Ring chart

HelpDesk
How to Edit a Project Task List

Bubble diagrams with ConceptDraw PRO

HelpDesk
How to Add a Concept Map to a PowerPoint Presentation Using ConceptDraw PRO

HelpDesk
How to Create an ERD Diagram
 using Chen's notation")
What Is a Concept Map

Concept Map

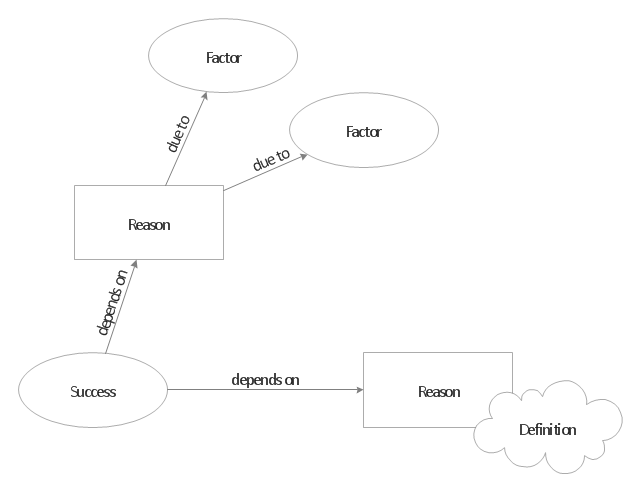
How to draw a Concept Map quick, easy and effective? ConceptDraw PRO offers the unique Concept Maps Solution from the "What is a Diagram" Area that will help you!
"A concept map is a diagram that depicts suggested relationships between concepts. It is a graphical tool that designers, engineers, technical writers, and others use to organize and structure knowledge. A concept map typically represents ideas and information as boxes or circles, which it connects with labeled arrows in a downward-branching hierarchical structure. The relationship between concepts can be articulated in linking phrases such as causes, requires, or contributes to. The technique for visualizing these relationships among different concepts is called concept mapping. Concept maps define the ontology of computer systems, for example with the object role modeling or Unified Modeling Language formalism." [Concept map. Wikipedia]
The concept map template for the ConceptDraw PRO diagramming and vector drawing software is included in the Concept Maps solution from the area "What is a Diagram" of ConceptDraw Solution Park.
The concept map template for the ConceptDraw PRO diagramming and vector drawing software is included in the Concept Maps solution from the area "What is a Diagram" of ConceptDraw Solution Park.
Concept map template
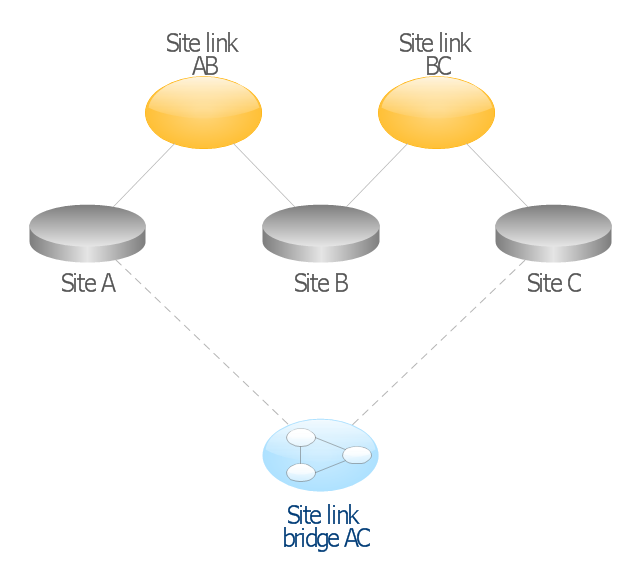
This AD diagram example was redesigned from the picture "Site links" from the book "Active Directory for Dummies".
"Site links represent the Active Directory replication paths between sites.
These paths are manually defined so that the designer has control over which network links the replication traffic occurs on. These site links also control how clients are directed to domain controllers when there’s no DC in the client’s local site. Each site link has the following attributes:
(1) Connected sites: A site link is defined by the sites to which it connects. A site link can connect two or more sites together.
(2) Network transport: Site links support replication communication over IP-based RPCs or with the Simple Mail Transport Protocol (SMTP). You normally want to use RPC whenever possible, but you can use SMTP when the sites you’re linking don’t support RPC.
(3) Cost: Each site link has a cost associated with it. Costs are used to assign preferences to links that determine which link should be followed when multiple link paths are available between sites. The cost represents what it “costs” to use this site link relative to the other site links and affects replication traffic as well as how users are assigned a domain controller. Links with lower cost values have preference over links with higher cost values. Cost values range from 1–32,767; the default being 100.
(4) Frequency: The frequency value defines how often a replication occurs
when using this site link (the replication latency). You can configure the time between replications from a minimum of 15 minutes to a maximum of 10,080 minutes (one week). The default frequency is 180 minutes.
(5) Schedule: The schedule dictates when this link is active and available for replication between the sites. The schedule can also control which days of the week the link is available. Normally, the schedule is set so that the link is available 24 hours a day, but you can set up different schedules on a per-day-of-the-week basis.
By creating a site link, you enable two or more sites to be connected and to share the same site link attributes (transport, cost, frequency, and schedule). By default, site links create transitive connectivity between sites.
If you create a site link between sites A and B and another site link between
sites B and C, an automatic connection (known as a site link bridge) is created between sites A and C..." [Steve Clines and Marcia Loughry, Active Directory® For Dummies®, 2nd Edition. 2008]
The Active Directory diagram example "Site links" was created using the ConceptDraw PRO diagramming and vector drawing software extended with the Active Directory Diagrams solution from the Computer and Networks area of ConceptDraw Solution Park.
Active Directory network diagram
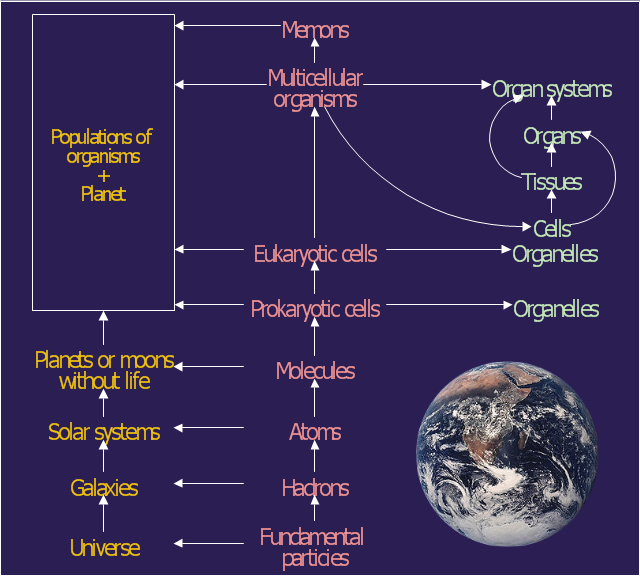
This diagram example was redesigned from the Wikimedia Commons file: Operator hierarchy - natural hierarchy rearranged.gif.
The diagram shows rearrangement of the classical ecological/ system hierarchy. From left to right the columns represent interaction systems, operators and internal differentiations (Gerard Jagers op Akkerhuis).
The diagram was published at page 249 of Jagers op Akkerhuis, G.A.J.M. (2010). The operator hierarchy: a chain of closures linking matter, life and artificial intelligence. PhD thesis Radboud university Nijmegen, the Netherlands: 286 pp.
[commons.wikimedia.org/ wiki/ File:Operator_ hierarchy_ -_ natural_ hierarchy_ rearranged.gif]
The astronomic diagram example "Operator hierarchy - Natural hierarchy rearranged" was created using the ConceptDraw PRO diagramming and vector drawing software extended with the Astronomy solution from the Science and Education area of ConceptDraw Solution Park.
Rearrangement of the classical ecological/system hierarchy
The website wireframe vector stencils library "Advertisement" contains 17 banner add blocks.
Use these web banner design elements to layout advertisement on your webpages using ConceptDraw PRO diagramming and vector drawing software.
"A web banner or banner ad is a form of advertising on the World Wide Web delivered by an ad server. This form of online advertising entails embedding an advertisement into a web page. It is intended to attract traffic to a website by linking to the website of the advertiser. In many cases, banners are delivered by a central ad server." [en.wikipedia.org/ wiki/ Web_ banner]
The banner add blocks example "Design elements - Advertisement" is included in the Website Wireframe solution from the Software Development area of ConceptDraw Solution Park.
Website wireframe design elements

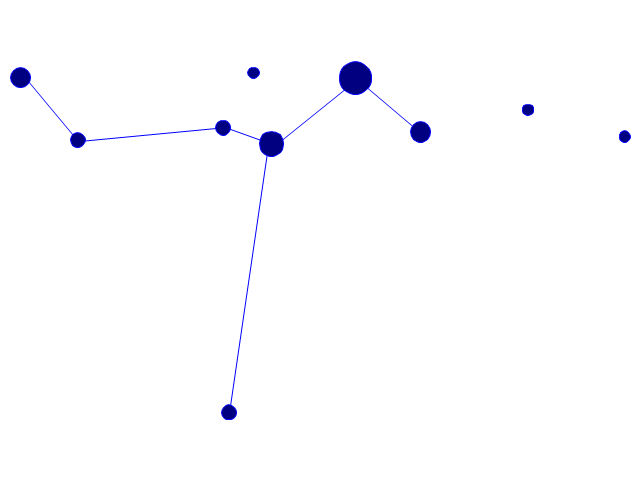
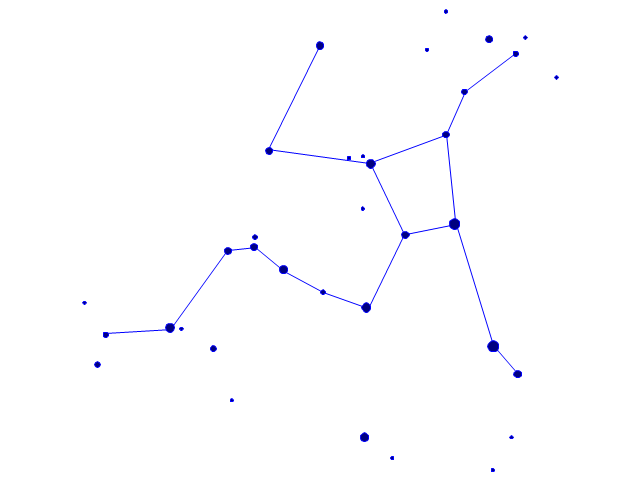
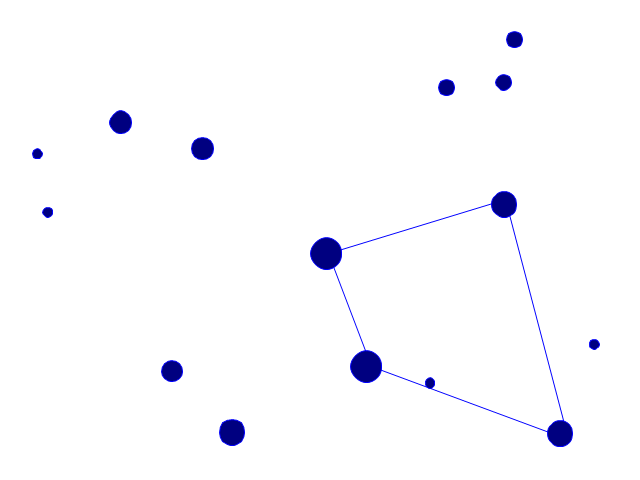
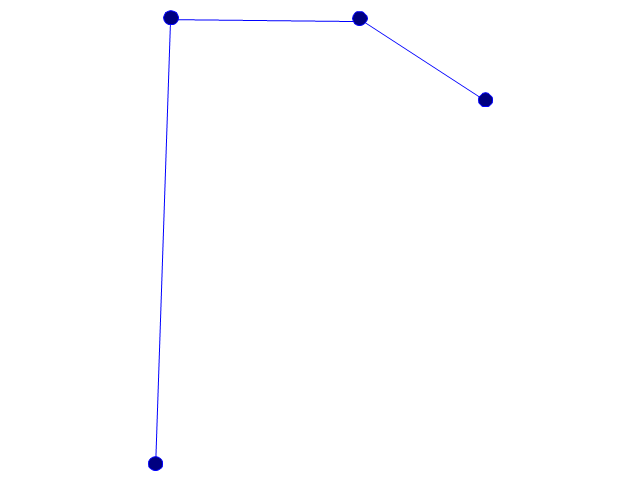
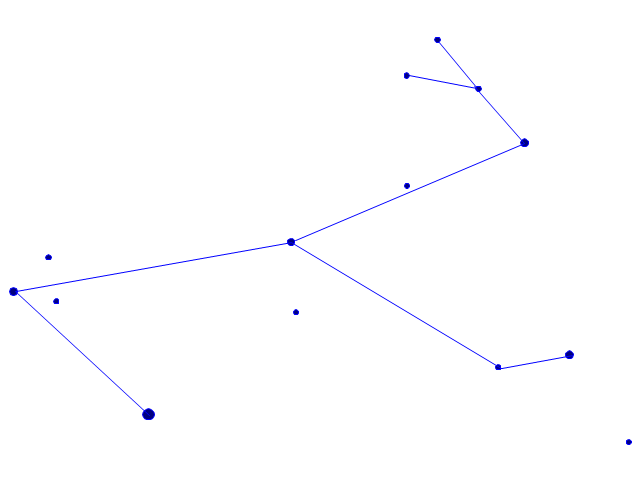
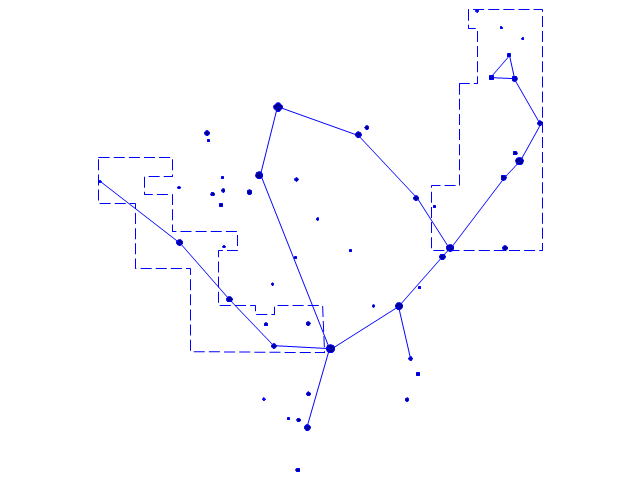
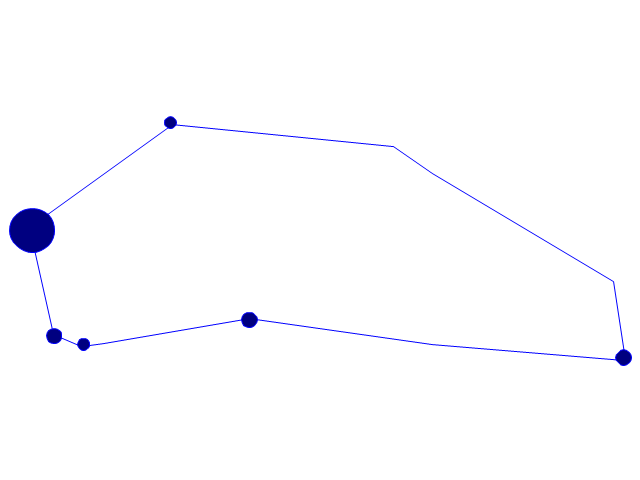
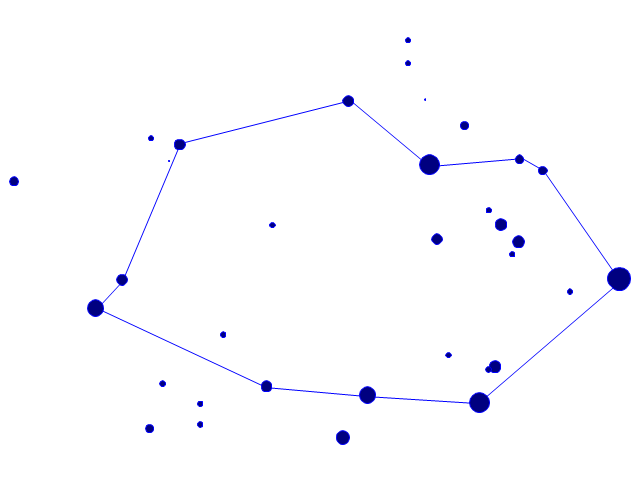
The vector stencils library "Constellations except Zodiac, Northern and Southern" contains 47 star constellation maps of all constellations except Zodiac, Northern (45-90 degrees) and Southern (45-90 degrees).
Use these shapes for drawing astronomical diagrams and illustrations in ConceptDraw PRO diagramming and vector drawing software extended with the Astronomy solution from the Science and Education area in ConceptDraw Solution Park.
Use these shapes for drawing astronomical diagrams and illustrations in ConceptDraw PRO diagramming and vector drawing software extended with the Astronomy solution from the Science and Education area in ConceptDraw Solution Park.
Andromeda

Antlia

Aquila

Auriga

Bootes

Caelum

Canes Venatici

Canis Major

Canis Minor

Centaurus

Cetus

Columba
Coma Berenices
Corona Australis

Corona Borealis

Corvus
Crater

Cygnus

Delphinus
Equuleus
Eridanus

Fornax

Grus

Hercules
Hydra

Lacerta

Leo Minor

Lepus
Lupus

Lynx

Lyra

Microscopium
Monoceros
Ophiuchus and Serpens
Orion

Pegasus

Perseus

Piscis Austrinus
Puppis

Pyxis

Sagitta
Sculptor

Scutum

Sextans

Triangulum
Vela
Vulpecula

- Linking Wiring Images Of Computer Lab
- Sentence diagram sample | Diagramming Sentences With Linking ...
- Diagram For Linking Two Conputer Or Communication Between
- Energy resources diagram | Manufacturing and Maintenance | Life ...
- Program to Make Flow Chart | Basic Diagramming | National ...
- Telecommunication networks. Computer and Network Examples ...
- Pie Chart Examples and Templates | Chart Examples | Donut Chart ...
- Graham's hierarchy of disagreement - Pyramid diagram | Venn ...
- Local area network (LAN). Computer and Network Examples ...
- Ansoff Matrix | Matrices | SWOT analysis matrix diagram templates ...
- Constellations except Zodiac, Northern and Southern - Vector ...
- Communication medium diagram
- SWOT and TOWS Matrix Diagrams | SWOT Analysis | How to Create ...
- Home area networks (HAN). Computer and Network Examples ...
- Cisco WAN - Vector stencils library | Cisco LAN - Vector stencils ...
- Design elements - Advertisement | User registration form | Vertical ...
- Conceptdraw.com: Mind Map Software, Drawing Tools | Project ...
- Wide area network (WAN) topology. Computer and Network Examples
- UML Class Diagram Example - Social Networking Site | UML Use ...
- Aerospace - Design Elements | Computer and Networks Area ...
- ERD | Entity Relationship Diagrams, ERD Software for Mac and Win
- Flowchart | Basic Flowchart Symbols and Meaning
- Flowchart | Flowchart Design - Symbols, Shapes, Stencils and Icons
- Flowchart | Flow Chart Symbols
- Electrical | Electrical Drawing - Wiring and Circuits Schematics
- Flowchart | Common Flowchart Symbols
- Flowchart | Common Flowchart Symbols