Line Graph

Line Chart Examples

Basic Diagramming


Pictures of Graphs

Picture Graph

How to Draw a Line Graph

What Is a Picture Graph?

Line Graph Charting Software

 Basic Line Graphs
This solution extends the capabilities of ConceptDraw DIAGRAM (or later) with templates, samples and a library of vector stencils for drawing Line Graphs.
Create Graphs and Charts

Scatter Graph

This pictorial chart sample shows the population growth by continent in 2010-2013.
"Population growth' refers to the growth in human populations. Global population growth is around 80 million annually, or 1.2% p.a. The global population has grown from 1 billion in 1800 to 7 billion in 2012. It is expected to keep growing to reach 11 billion by the end of the century. Most of the growth occurs in the nations with the most poverty, showing the direct link between high population growth and low standards of living. The nations with high standards of living generally have low or zero rates of population growth. Australia's population growth is around 400,000 annually, or 1.8% p.a., which is nearly double the global average. It is caused mainly by very high immigration of around 200,000 p.a., the highest immigration rate in the world. Australia remains the only nation in the world with both high population growth and high standards of living." [Population growth. Wikipedia]
The image chart example "Population growth by continent, 2010 - 2013" was created using the ConceptDraw PRO diagramming and vector drawing software extended with the Basic Picture Graphs solution from the Graphs and Charts area of ConceptDraw Solution Park.
Image chart

 Picture Graphs
Typically, a Picture Graph has very broad usage. They many times used successfully in marketing, management, and manufacturing. The Picture Graphs Solution extends the capabilities of ConceptDraw DIAGRAM with templates, samples, and a library of professionally developed vector stencils for designing Picture Graphs.
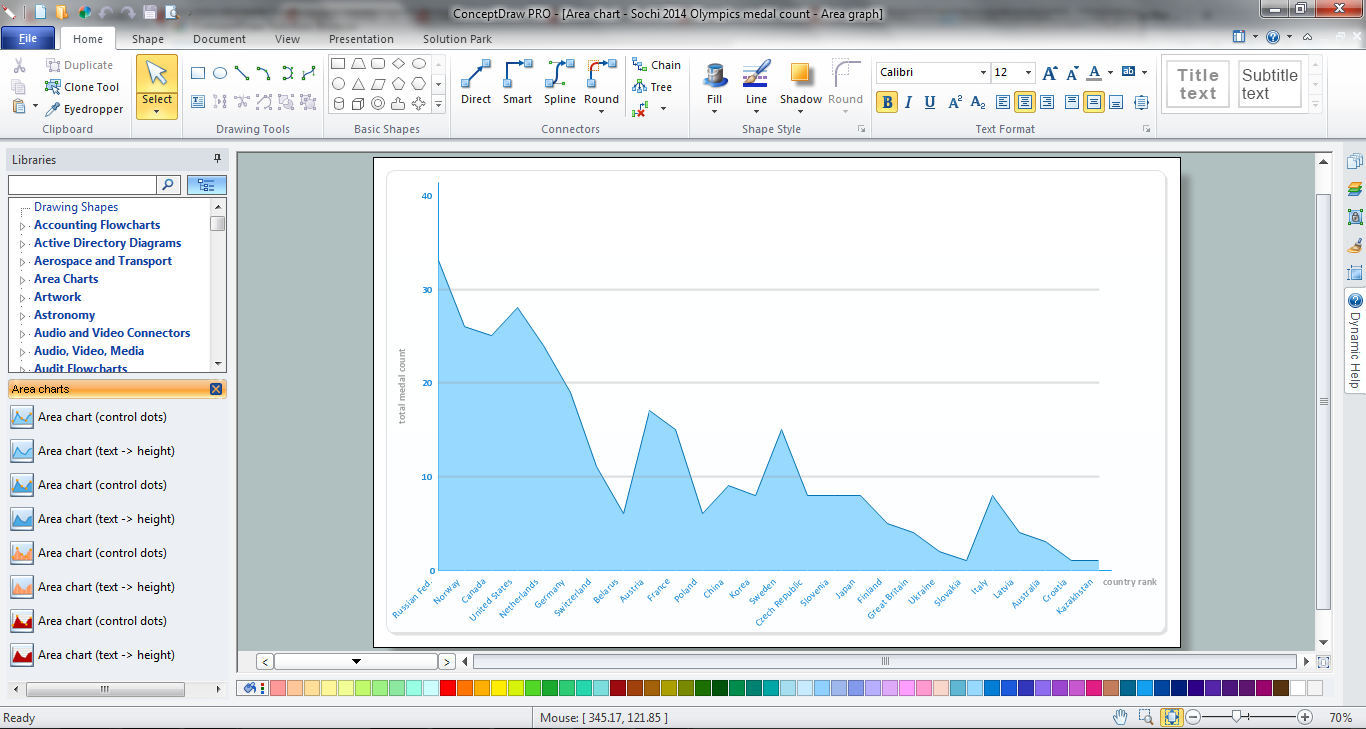
Area Chart
How To Create Floor Plans


- Line Graph For Population Growth
- Line Graph Of Population
- Pictures of Graphs | Population growth by continent | Line Graph ...
- Population growth by continent | Picture Graph | Pictures of Graphs ...
- Line Chart Example Of Population Growth
- Line Chart Examples | Population growth by continent | San ...
- Bar Graph Of Population Growth Rate
- Line Chart For Population Growth
- Line Graph About Population
- Pictures of Graphs | Regional population growth from 2010 to 2016 ...
- Scatter Plot Of Population Growth
- Bar Graphs | Sales Growth . Bar Graphs Example | Picture Graphs ...
- Line Chart Examples | Line Graph | Pictures of Graphs | Population ...
- Population Growth Pie Chart Image
- Line Graph Draw Population Growth
- Bar Graph About Population Growth
- Line Graph Of Population Growth Of Africa
- Line Chart Examples | Pictures of Graphs | Line Graph | Examples Of ...
- Population growth by continent | Infographic Maker | Sample ...
- Line Chart Examples | Basic Diagramming | Line Graph | Population ...
- ERD | Entity Relationship Diagrams, ERD Software for Mac and Win
- Flowchart | Basic Flowchart Symbols and Meaning
- Flowchart | Flowchart Design - Symbols, Shapes, Stencils and Icons
- Flowchart | Flow Chart Symbols
- Electrical | Electrical Drawing - Wiring and Circuits Schematics
- Flowchart | Common Flowchart Symbols
- Flowchart | Common Flowchart Symbols