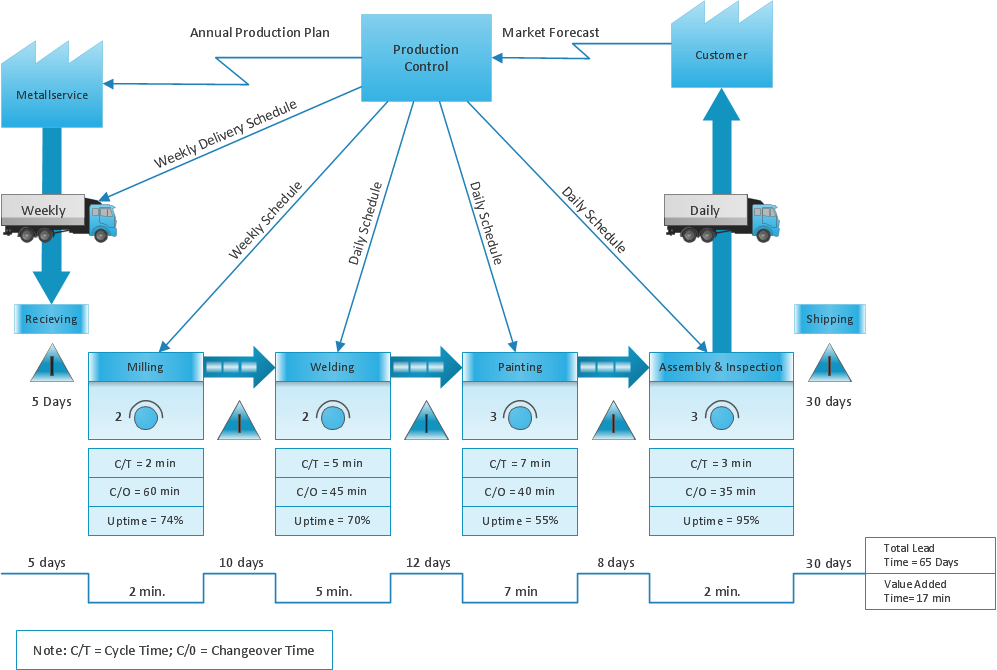
The Lean Enterprise Value Stream Mapping
Create value stream maps - for value stream analysis and value stream management, material and information flow mapping, using our quick start templates included with ConceptDraw.
 Value Stream Mapping
Value stream mapping solution extends ConceptDraw PRO software with templates, samples and vector stencils for drawing the Value Stream Maps (VSM) in lean manufacturing practice.
Data Flow Diagram Model
The DFD (Yourdon and Coad notation) example "Model of small traditional production enterprise" below was created using the ConceptDraw PRO diagramming and vector drawing software extended with the Data Flow Diagrams solution from the Software Development area of ConceptDraw Solution Park.Types of Flowcharts
A Flowchart is a graphically representation of the process, algorithm or the step-by-step solution of the problem. There are ten types of Flowcharts. Using the Flowcharts solution from the Diagrams area of ConceptDraw Solution Park you can easy and quickly design the Flowchart of any of these types.
How To Create Onion Diagram
An onion diagram is a kind of chart that shows the dependencies among parts of an organization or process. The chart displays items in concentric circles, where the items in each ring depend on the items in the smaller rings. The Onion Diagram is able to show layers of a complete system in a few circles.But how to create Onion Diagram? Now, it's very easy thanks to the ConceptDraw PRO diagramming and vector drawing software extended with Stakeholder Onion Diagrams Solution from the Management Area of ConceptDraw Solution Park.
 Quality Mind Map
This solution extends ConceptDraw MINDMAP software with Quality Management Mind Maps (Presentations, Meeting Agendas, Problem to be solved).
Business Diagram Software
ConceptDraw business diagram Software is the most powerful business and relational charting software. Create advanced, completely customizable flow charts, organizational charts, business process diagrams, work flow diagrams, audit diagram, value stream maps, TQM diagrams, ERD diagrams, EPC diagrams, marketing diagrams, cause and effect diagrams, dashboards, infographics and other relational business diagrams from your data.
- The Lean Enterprise Value Stream Mapping | Lean Manufacturing ...
- The Lean Enterprise Value Stream Mapping
- Value Stream Mapping for the Lean Office | The Lean Enterprise ...
- Lean Manufacturing Diagrams | Lean Six Sigma Diagram Software ...
- Lean Manufacturing Diagrams | Value Stream Mapping for the Lean ...
- Lean Value Stream Map
- Mactintosh Value Stream Mapping Software
- Value Stream Mapping for the Lean Office | Lean Manufacturing ...
- Lean Manufacturing Diagrams | Value - Stream Mapping for ...
- Lean Manufacturing Diagrams | Lean Value Stream | Value Stream ...
- Lean Value Stream Map
- Lean Manufacturing Diagrams | Lean Value Stream | Value - Stream ...
- Value Stream Mapping for the Lean Office | Lean Manufacturing ...
- Best Value Stream Mapping mac Software | Lean Manufacturing ...
- Value Stream Map Financial Report
- Value - Stream Mapping for Manufacturing
- Value - Stream Mapping for Manufacturing | Lean Manufacturing ...
- Value - Stream Mapping for Manufacturing | Lean Six Sigma Diagram ...
- Value Stream Mapping for the Lean Office | Value Stream ...
- Learn how to create a current state value stream map | Best Value ...
- ERD | Entity Relationship Diagrams, ERD Software for Mac and Win
- Flowchart | Basic Flowchart Symbols and Meaning
- Flowchart | Flowchart Design - Symbols, Shapes, Stencils and Icons
- Flowchart | Flow Chart Symbols
- Electrical | Electrical Drawing - Wiring and Circuits Schematics
- Flowchart | Common Flowchart Symbols
- Flowchart | Common Flowchart Symbols


