How to Create a Line Chart

How to draw Metro Map style infographics? Moscow, New York, Los Angeles, London

HelpDesk
How to Draw a Line Chart Quickly

Infographic design elements, software tools Subway and Metro style

How to Create a Scatter Chart

This vector stencils library contains 22 symbols of process annotations for setting automatic labels to display a datasheet field for a pipeline shape, labels, captions, outlines, off-sheet labels, text balloons, annotations, outlines, tags, and descriptions.
Use these shapes for drawing Process Flow Diagrams (PFD) and Piping and Instrumentation Diagrams (P&ID) in the ConceptDraw PRO software extended with the Chemical and Process Engineering solution from the Chemical and Process Engineering area of ConceptDraw Solution Park.
www.conceptdraw.com/ solution-park/ engineering-chemical-process
Interface point
Interface point 2 (1st half filled)
-process-annotations---vector-stencils-library.png--diagram-flowchart-example.png)
Interface point 3 (2nd half filled)
-process-annotations---vector-stencils-library.png--diagram-flowchart-example.png)
Interface point 4

Interface point 5 (1st half filled)
-process-annotations---vector-stencils-library.png--diagram-flowchart-example.png)
Interface point 6 (2nd half filled)
-process-annotations---vector-stencils-library.png--diagram-flowchart-example.png)
Slope

Off-sheet label 1

Off-sheet label 2

Off-sheet label 3

Callout 1

Callout 2

Callout 3
Callout 4

Callout 5

Callout 6
8 pt text and line

10 pt text and line

12 pt text and line

12 pt Arial text block
10 pt Arial text block
8 pt Arial text block
How to draw Metro Map style infographics? (Los Angeles)

This is a one-click tool to add stations to the map. It lets you control the direction in which you create new stations, change lengths, and add text labels and icons. It contains Lines, Stations, and Landmarks objects.
HelpDesk
How to Add and Edit Text on Connectors

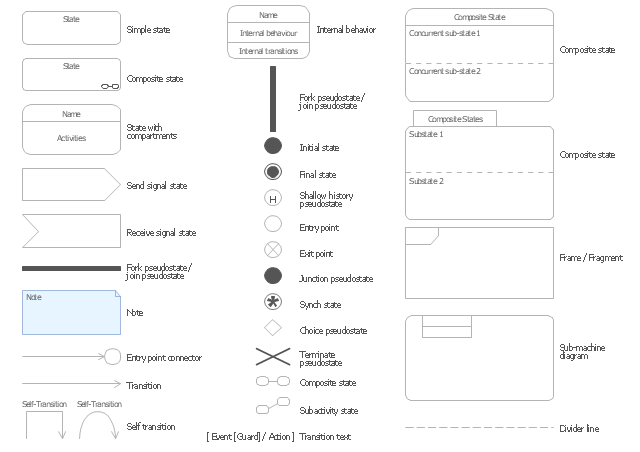
The vector stencils library "UML state machine diagrams" contains 35 symbols for the ConceptDraw PRO diagramming and vector drawing software.
"The state diagram in the Unified Modeling Language is essentially a Harel statechart with standardized notation, which can describe many systems, from computer programs to business processes. In UML 2 the name has been changed to State Machine Diagram. The following are the basic notational elements that can be used to make up a diagram:
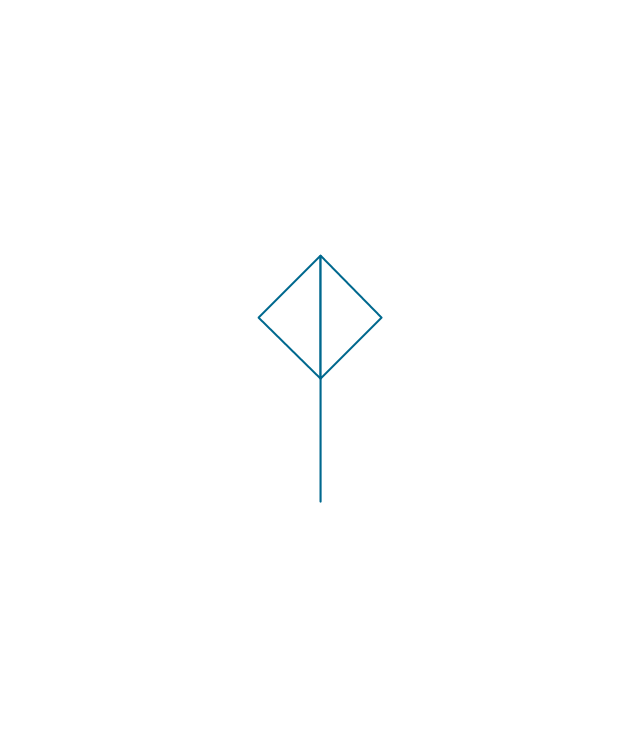
(1) Filled circle, pointing to the initial state.
(2) Hollow circle containing a smaller filled circle, indicating the final state (if any).
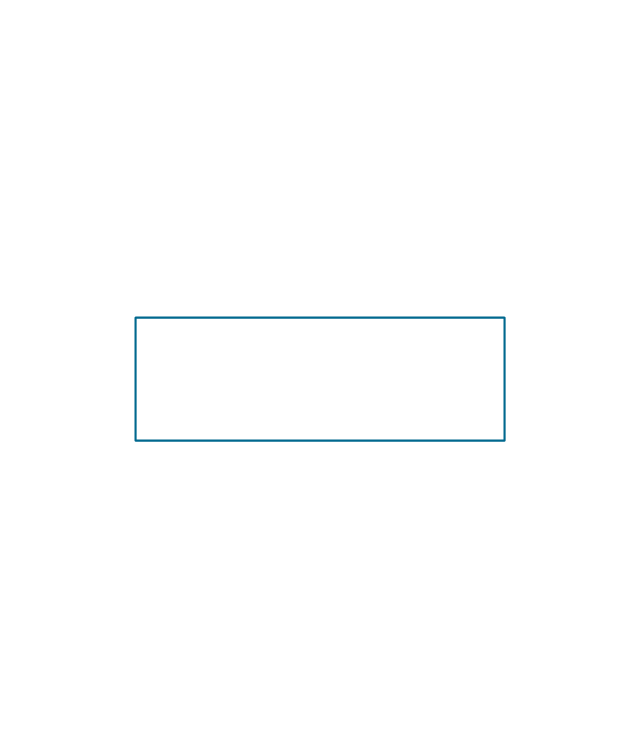
(3) Rounded rectangle, denoting a state. Top of the rectangle contains a name of the state. Can contain a horizontal line in the middle, below which the activities that are done in that state are indicated.
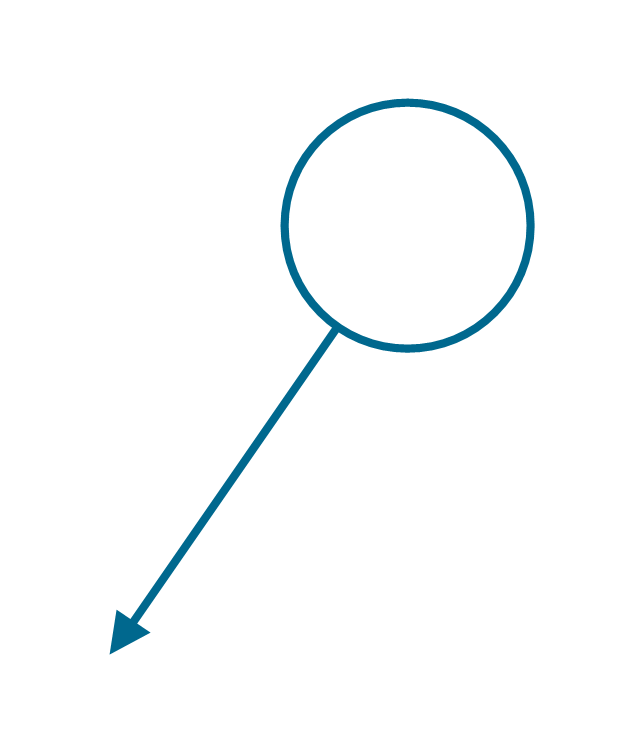
(4) Arrow, denoting transition. The name of the event (if any) causing this transition labels the arrow body. A guard expression may be added before a "/ " and enclosed in square-brackets ( eventName[guardExpression] ), denoting that this expression must be true for the transition to take place. If an action is performed during this transition, it is added to the label following a "/ " ( eventName[guardExpression]/ action ).
(5) Thick horizontal line with either x>1 lines entering and 1 line leaving or 1 line entering and x>1 lines leaving. These denote join/ fork, respectively." [State diagram (UML). Wikipedia]
The example "Design elements - UML state machine diagrams" is included in the Rapid UML solution from the Software Development area of ConceptDraw Solution Park.
"The state diagram in the Unified Modeling Language is essentially a Harel statechart with standardized notation, which can describe many systems, from computer programs to business processes. In UML 2 the name has been changed to State Machine Diagram. The following are the basic notational elements that can be used to make up a diagram:
(1) Filled circle, pointing to the initial state.
(2) Hollow circle containing a smaller filled circle, indicating the final state (if any).
(3) Rounded rectangle, denoting a state. Top of the rectangle contains a name of the state. Can contain a horizontal line in the middle, below which the activities that are done in that state are indicated.
(4) Arrow, denoting transition. The name of the event (if any) causing this transition labels the arrow body. A guard expression may be added before a "/ " and enclosed in square-brackets ( eventName[guardExpression] ), denoting that this expression must be true for the transition to take place. If an action is performed during this transition, it is added to the label following a "/ " ( eventName[guardExpression]/ action ).
(5) Thick horizontal line with either x>1 lines entering and 1 line leaving or 1 line entering and x>1 lines leaving. These denote join/ fork, respectively." [State diagram (UML). Wikipedia]
The example "Design elements - UML state machine diagrams" is included in the Rapid UML solution from the Software Development area of ConceptDraw Solution Park.
UML state machine diagram symbols
Ice Hockey Rink Dimensions

"A chart can take a large variety of forms, however there are common features that provide the chart with its ability to extract meaning from data.
Typically the data in a chart is represented graphically, since humans are generally able to infer meaning from pictures quicker than from text. Text is generally used only to annotate the data.
One of the more important uses of text in a graph is the title. A graph's title usually appears above the main graphic and provides a succinct description of what the data in the graph refers to.
Dimensions in the data are often displayed on axes. If a horizontal and a vertical axis are used, they are usually referred to as the x-axis and y-axis respectively. Each axis will have a scale, denoted by periodic graduations and usually accompanied by numerical or categorical indications. Each axis will typically also have a label displayed outside or beside it, briefly describing the dimension represented. If the scale is numerical, the label will often be suffixed with the unit of that scale in parentheses. ...
Within the graph a grid of lines may appear to aid in the visual alignment of data. The grid can be enhanced by visually emphasizing the lines at regular or significant graduations. The emphasized lines are then called major grid lines and the remainder are minor grid lines.
The data of a chart can appear in all manner of formats, and may include individual textual labels describing the datum associated with the indicated position in the chart. The data may appear as dots or shapes, connected or unconnected, and in any combination of colors and patterns. Inferences or points of interest can be overlaid directly on the graph to further aid information extraction.
When the data appearing in a chart contains multiple variables, the chart may include a legend (also known as a key). A legend contains a list of the variables appearing in the chart and an example of their appearance. This information allows the data from each variable to be identified in the chart." [Chart. Wikipedia]
The vector stencils library "Time series charts" contains 10 templates: 3 column charts, 3 bar charts, 2 line graphs and 2 dot plots. All these charts are Live Objects displaying the data from external data source files.
Use these chart templates to design your business performance digital dashboards using the ConceptDraw PRO diagramming and vector drawing software.
The example "Design elements - Time series charts" is included in the Time Series Dashboard solution from the area "What is a Dashboard" of ConceptDraw Solution Park.
Time series charts

Process Flowchart


How to Create a Column Chart

- Liner Text Png
- The 100th Tour de France - Route map | ARL route map | ELR route ...
- New Style Png
- Png Series
- Vector Directional Signs Png
- Vertical White Line Transparent Png
- ELR route map
- Process Vector Png
- How to Create a Column Chart | How to Create a Line Chart | How to ...
- How to Create a Line Chart | Column Chart Software | Design ...
- Png Rectangle Designs
- ER Diagram Styles | How to Customize the Style of Your Mind Map ...
- Multiprotocol Label Switching (MPLS). Computer and Network ...
- The 100th Tour de France - Route map | How to Create a Powerful ...
- UML State Machine Diagram.Design Elements | Vector stencils ...
- Post Man Png
- ARL route map | Metro Maps | Emergency Plan | Route Map Easy ...
- State machine diagram | Diagramming Software for Design UML ...
- Draw And Label A Football Pitch
- Design elements - Time series charts | Line Chart Template for Word ...
- ERD | Entity Relationship Diagrams, ERD Software for Mac and Win
- Flowchart | Basic Flowchart Symbols and Meaning
- Flowchart | Flowchart Design - Symbols, Shapes, Stencils and Icons
- Flowchart | Flow Chart Symbols
- Electrical | Electrical Drawing - Wiring and Circuits Schematics
- Flowchart | Common Flowchart Symbols
- Flowchart | Common Flowchart Symbols