This site uses cookies. By continuing to browse the ConceptDraw site you are agreeing to our Use of Site Cookies.

A KPI Dashboard Provides the Answers Your Sales Team

Sales dashboard is a tool that provides the answers to all questions your sales team may have. A mature sales dashboard provides complete set of KPI to shows corporate, team or personal performance to keep sales process clear.

Sales KPI Dashboards

A combination of sales KPI on a one dashboard helps you track sales activities and results. Visualizing sales data using ConceptDraw DIAGRAM software extended with the Sales Dashboard solutiongives you flexibility in choosing and tuning KPIs.

Sales Dashboards for Your Company

ConceptDraw DIAGRAM software extended with the Sales Dashboard solution allows you produce sales dashboards for your company easily. You can start from samples and templates delivered with the solution and then modify them to get a dashboard that suites your specific needs.

What is a KPI?

What is a KPI? Key performance indicators (KPIs) represent a set of measures that are focused on the aspects of organizational performance which are the most important for its current and future success.
ConceptDraw DIAGRAM diagramming and vector drawing software enhanced with Sales Dashboard solution from the Marketing area of ConceptDraw Solution Park allows effectively develop, analyze and improve your business thanks to the excellent possibility of monitoring all KPIs on one screen in a real time.

Visualize Sales Data Using Sample Data

ConceptDraw DIAGRAM software extended with the Sales Dashboard solution allows you visualize sales data using sample data delivered with the solution to choose visual indicators you need, and then connect these indicators to your real data.

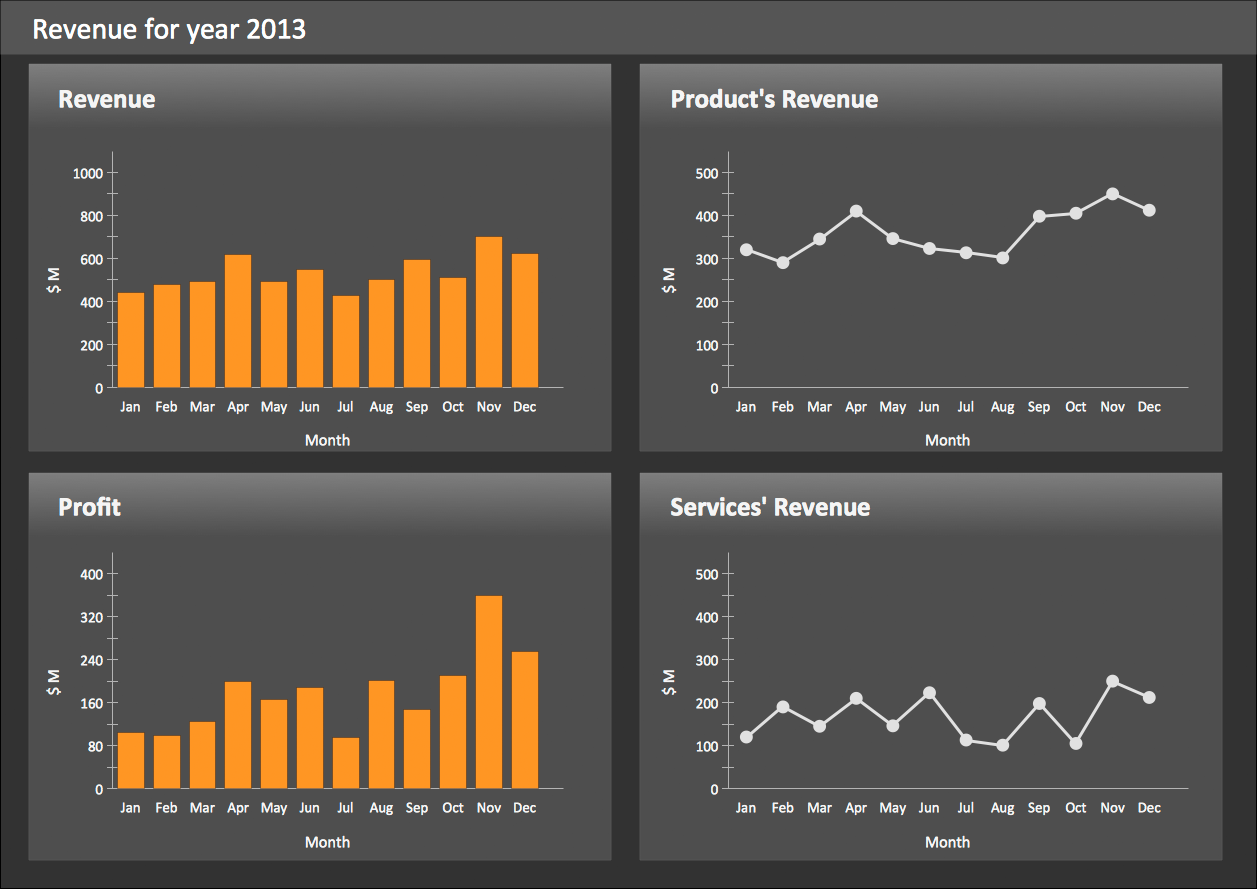
Sales Dashboard Screenshot

ConceptDraw DIAGRAM software exteneded with the Sales Dashboard solution is perfect for visualizing sales data. This is the best tool to analyse your sales perfornance and see how your business can improve.

TQM Diagram Example

The Total Quality Management Diagram solution helps you and your organization visualize business and industrial processes. Create Total Quality Management diagrams for business process with ConceptDraw software.

KPI Dashboard

ConceptDraw DIAGRAM diagramming and vector drawing software supplied with Sales Dashboard solution from the Marketing area of ConceptDraw Solution Park provides the full set of useful tools which make it the best for producing the live KPI Dashboard of any complexity.

Data Visualization Solutions

Data visualization solutions help you to see how your business can improve. Visualizing sales data using ConceptDraw Sales Dashboard gives you a bird's-eye view of the sale process.

The Facts and KPIs

Visualizing sales data help you see the facts and KPIs about your sales process to make conclusions and see how your business can improve.