 HR Dashboard
The HR Dashboard solution extends ConceptDraw DIAGRAM functionality with powerful drawing tools and great collection of comprehensive vector design elements, icons, pictograms and objects, navigation elements, live objects of HR charts, HR indicators, and thematic maps. The range of HR Dashboards applications is extensive, among them the human resource management, recruitment, hiring process, human resource development. ConceptDraw DIAGRAM software is perfect for creation HR Dashboard with any goal you need. It gives you all opportunities for designing not only informative, but also professional looking and attractive HR Dashboards of any style and degree of detalization, that are perfect for using in presentations, reports and other thematic documents.
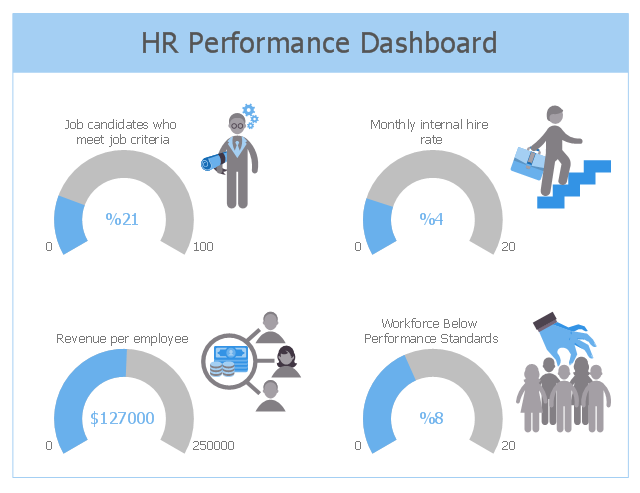
This HR dashboard sample depicts KPIs: job candidates who meet job criteria, monthly internal hire rate, revenue per employee, workforce below performance standards.
"Dashboards often provide at-a-glance views of KPIs (key performance indicators) relevant to a particular objective or business process (e.g. sales, marketing, human resources, or production).
... a human resources dashboard may show numbers related to staff recruitment, retention and composition, for example number of open positions, or average days or cost per recruitment." [Dashboard (business). Wikipedia]
The human resources dashboard example "HR Performance Dashboard" was designed using ConceptDraw PRO software extended with HR Dashboard solution from Management area of ConceptDraw Solution Park.
KPIs dashboard
Visualize Sales Data Using Sample Data

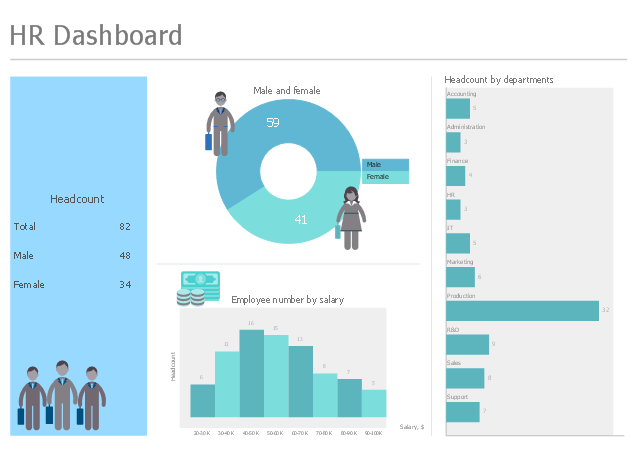
This HR dashboard sample shows business metrics and KPIs for human resources management: headcount, male and female ratio, employee distribution by salary, headcount by departments.
"Human Resource Management (HRM or HR) is the management of human resources. It is designed by the HR Department to maximize employee performance in service of an employer's strategic objectives. HR is primarily concerned with the management of people within organizations, focusing on policies and on systems. HR departments are responsible for overseeing employee-benefits design, employee recruitment, training and development, performance appraisal, and rewarding (e.g., managing pay and benefit systems)." [Human resource management. Wikipedia]
The human resources dashboard example "HR Dashboard" was designed using ConceptDraw PRO software extended with HR Dashboard solution from Management area of ConceptDraw Solution Park.
Human resources dashboard
Performance Indicators

The Facts and KPIs

TQM Diagram Example

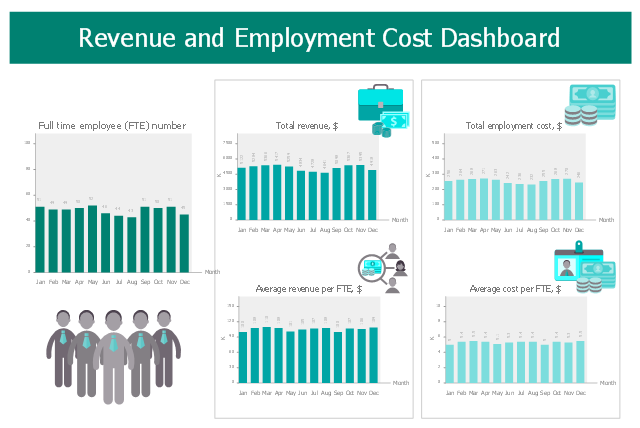
This HR dashboard sample visualizes KPIs: full time employee (FTE) number, total revenue, average revenue per FTE, total employment cost, average cost per FTE.
"Employment is a relationship between two parties, usually based on a contract where work is paid for, where one party, which may be a corporation, for profit, not-for-profit organization, co-operative or other entity is the employer and the other is the employee. Employees work in return for payment, which may be in the form of an hourly wage, by piecework or an annual salary, depending on the type of work an employee does or which sector she or he is working in. Employees in some fields or sectors may receive gratuities, bonus payment or stock options. In some types of employment, employees may receive benefits in addition to payment. Benefits can include health insurance, housing, disability insurance or use of a gym." [Employment. Wikipedia]
The human resources dashboard example "Revenue and Employment Cost Dashboard" was designed using ConceptDraw PRO software extended with HR Dashboard solution from Management area of ConceptDraw Solution Park.
HR dashboard
Sales Dashboard Solutions can help your sales team keep an eye on performance

Data Visualization Software Solutions

- Human Resources Kpis Examples
- Enterprise dashboard | KPI Dashboard | HR Flowcharts | Human ...
- KPI Dashboard | Visualize Sales Data Using Sample Data ...
- Recruitment Kpi Examples
- Status Dashboard | Projects HR dashboard | A KPI Dashboard ...
- Hr Metrics Dashboard Example
- KPI Dashboard | Enterprise dashboard | Composition Dashboard ...
- Recruitment Metrics Examples
- KPIs and Metrics | Visualize Sales Data Using Sample Data | Sales ...
- Kpi Examples
- ERD | Entity Relationship Diagrams, ERD Software for Mac and Win
- Flowchart | Basic Flowchart Symbols and Meaning
- Flowchart | Flowchart Design - Symbols, Shapes, Stencils and Icons
- Flowchart | Flow Chart Symbols
- Electrical | Electrical Drawing - Wiring and Circuits Schematics
- Flowchart | Common Flowchart Symbols
- Flowchart | Common Flowchart Symbols