Export from ConceptDraw DIAGRAM Document to PDF (Adobe Acrobat®) File

Export from ConceptDraw DIAGRAM Document to MS Visio® XML

Now you can share your ConceptDraw documents with MS Visio users.
"Dashboards give signs about a business letting the user know something is wrong or something is right. ...
Balanced Scoreboards and Dashboards have been linked together as if they were interchangeable. However, although both visually display critical information, the difference is in the format: Scoreboards can open the quality of an operation while dashboards provide calculated direction. A balanced scoreboard has what they called a “prescriptive” format. It should always contain these components (Active Strategy) ...
(1) Perspectives – groupings of high level strategic areas.
(2) Objectives – verb-noun phrases pulled from a strategy plan.
(3) Measures – also called Metric or Key Performance Indicators (KPIs).
(4) Spotlight Indicators – red, yellow, or green symbols that provide an at-a-glance view of a measure’s performance.
Each of these sections ensures that a Balanced Scorecard is essentially connected to the businesses critical strategic needs.
The design of a dashboard is more loosely defined. Dashboards are usually a series of graphics, charts, gauges and other visual indicators that can be monitored and interpreted. Even when there is a strategic link, on a dashboard, it may not be noticed as such since objectives are not normally present on dashboards. However, dashboards can be customized to link their graphs and charts to strategic objectives." [Dashboard (business). Wikipedia]
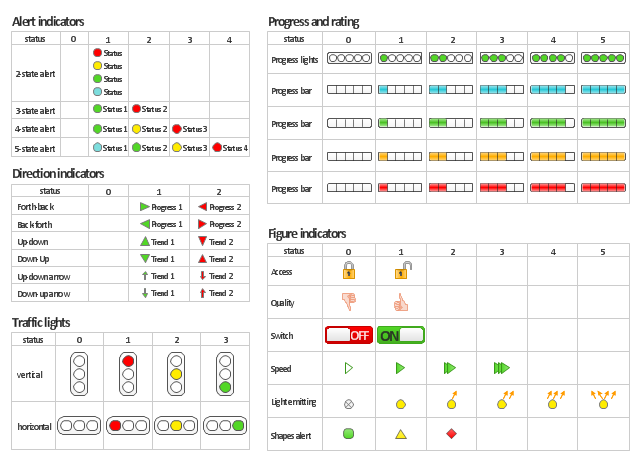
The vector stencils library "Status indicators" contains 41 visual status indicators for creating the business performance dashboards using the ConceptDraw PRO diagramming and vector drawing software.
Each status indicator can visualize one of 2-6 information states and have a caption.
Status indicators allow you quickly estimate, where your immediate decision and action is critical.
The example "Design elements - Status indicators" is included in the Status Dashboard solution from the area "What is a Dashboard" of ConceptDraw Solution Park.
Balanced Scoreboards and Dashboards have been linked together as if they were interchangeable. However, although both visually display critical information, the difference is in the format: Scoreboards can open the quality of an operation while dashboards provide calculated direction. A balanced scoreboard has what they called a “prescriptive” format. It should always contain these components (Active Strategy) ...
(1) Perspectives – groupings of high level strategic areas.
(2) Objectives – verb-noun phrases pulled from a strategy plan.
(3) Measures – also called Metric or Key Performance Indicators (KPIs).
(4) Spotlight Indicators – red, yellow, or green symbols that provide an at-a-glance view of a measure’s performance.
Each of these sections ensures that a Balanced Scorecard is essentially connected to the businesses critical strategic needs.
The design of a dashboard is more loosely defined. Dashboards are usually a series of graphics, charts, gauges and other visual indicators that can be monitored and interpreted. Even when there is a strategic link, on a dashboard, it may not be noticed as such since objectives are not normally present on dashboards. However, dashboards can be customized to link their graphs and charts to strategic objectives." [Dashboard (business). Wikipedia]
The vector stencils library "Status indicators" contains 41 visual status indicators for creating the business performance dashboards using the ConceptDraw PRO diagramming and vector drawing software.
Each status indicator can visualize one of 2-6 information states and have a caption.
Status indicators allow you quickly estimate, where your immediate decision and action is critical.
The example "Design elements - Status indicators" is included in the Status Dashboard solution from the area "What is a Dashboard" of ConceptDraw Solution Park.
Visual status indicators
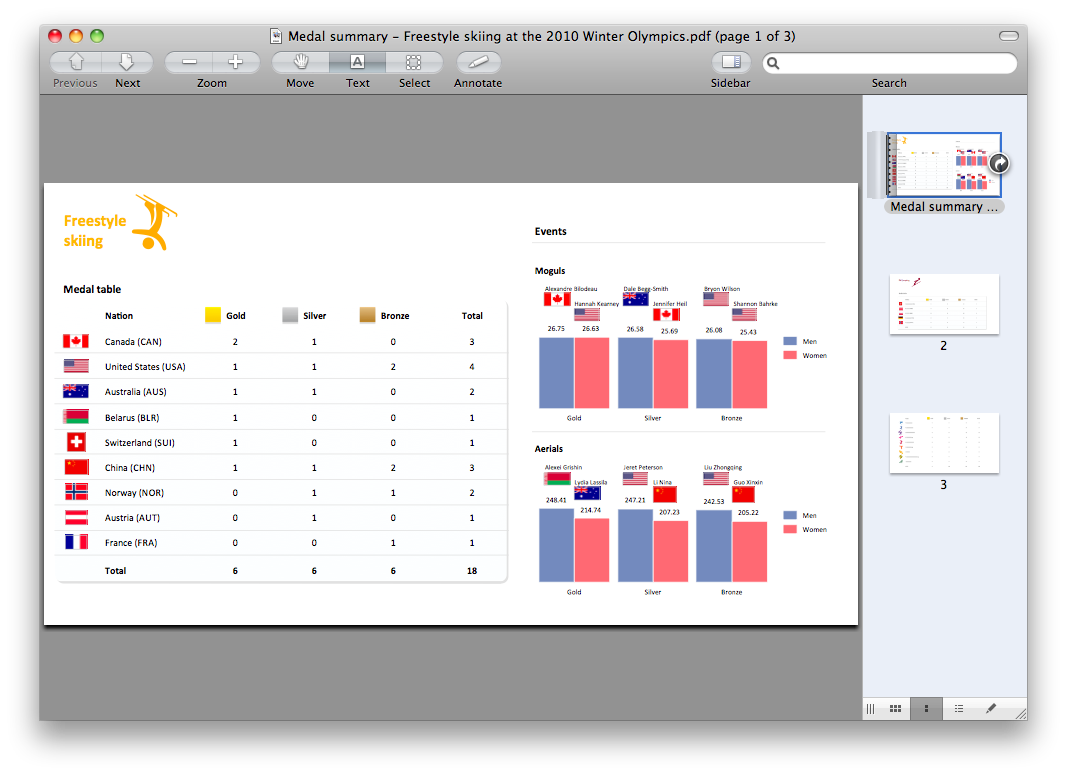
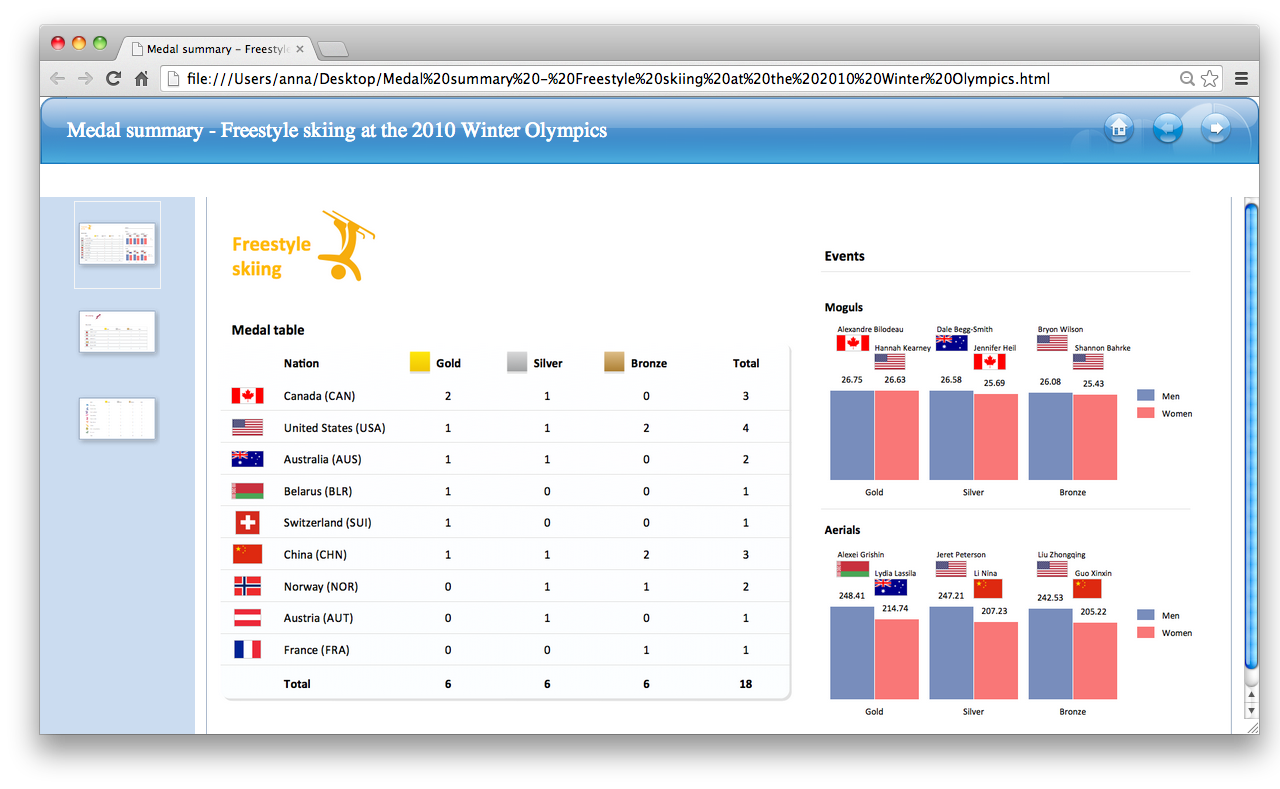
Export from ConceptDraw DIAGRAM Document to HTML
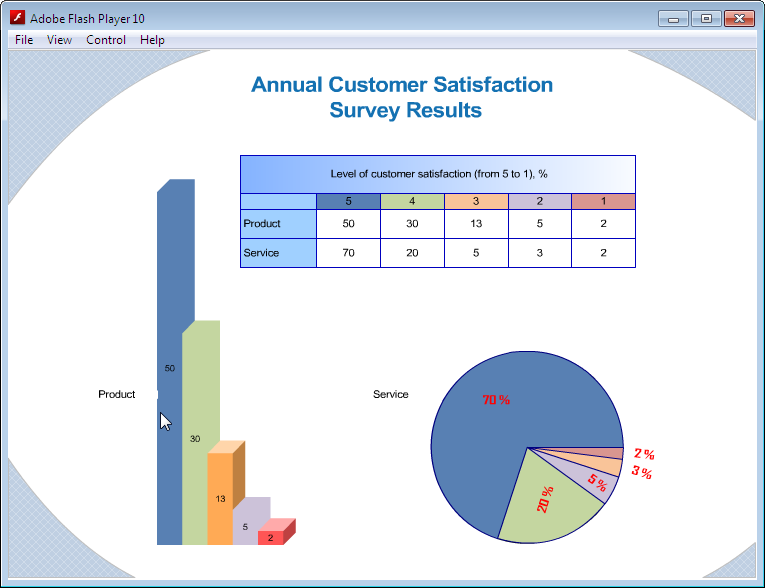
Export from ConceptDraw DIAGRAM Document to SWF (Adobe® Flash®) File
 Sales Dashboard
Sales Dashboard solution extends ConceptDraw DIAGRAM software with templates, samples and library of vector stencils for drawing the visual dashboards of sale metrics and key performance indicators (KPI).
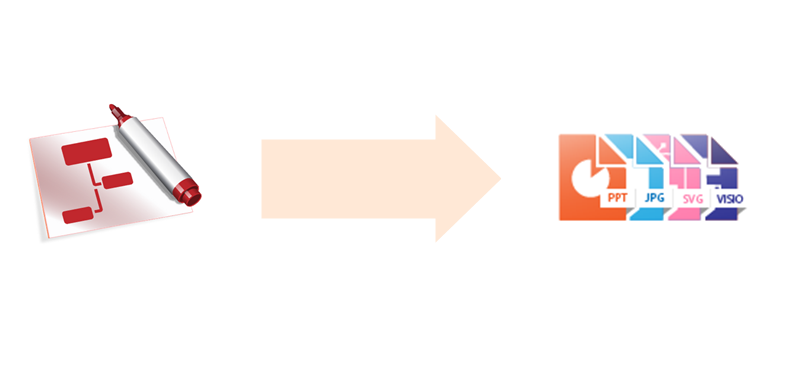
Export from ConceptDraw DIAGRAM Document to a Graphic File

ConceptDraw DIAGRAM can save your drawings and diagrams in a number of highly useful formats, including graphic files. You can save your drawing as a.PNG,.JPG, or other graphic format file.
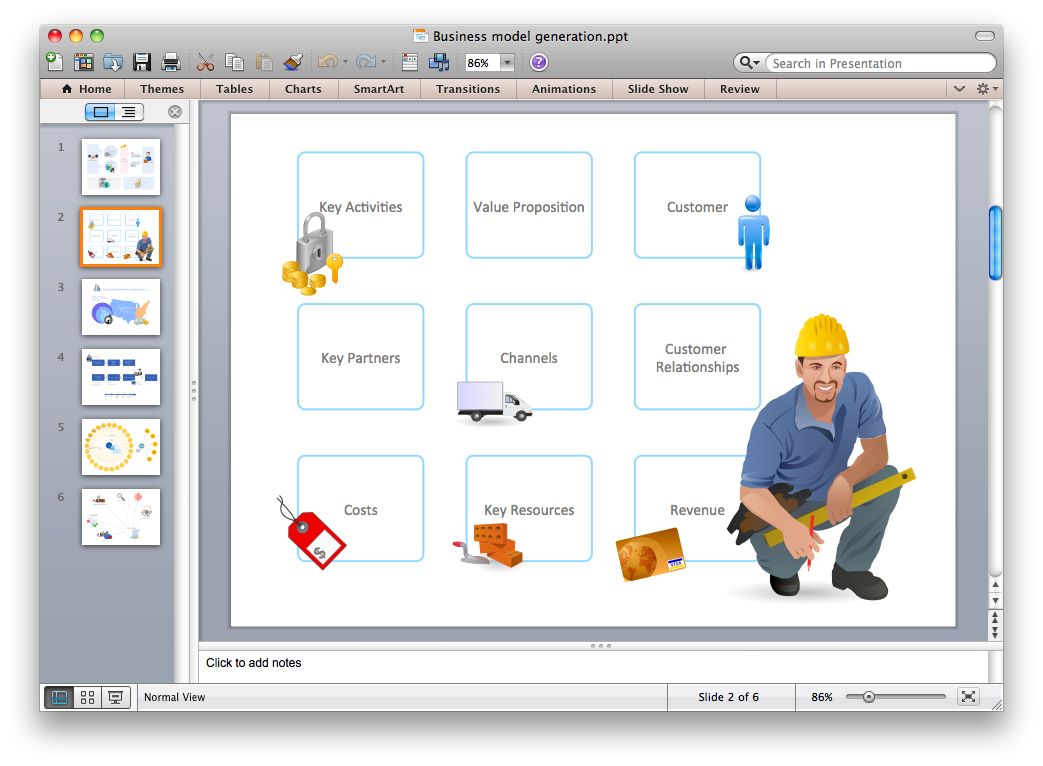
Export from ConceptDraw DIAGRAM Document to PPT or PPTX (MS PowerPoint®) File
HelpDesk
How to Create a Time Series Dashboard

ConceptDraw DIAGRAM Export Capabilities
Software development with ConceptDraw DIAGRAM

- Sales KPI Dashboards | Export from ConceptDraw PRO Document ...
- A KPI Dashboard Provides the Answers Your Sales Team | Export ...
- PM Dashboards | Design elements - Status indicators | Website KPIs ...
- Website KPIs - Visual dashboard | KPIs and Metrics | Sales KPIs ...
- A KPI Dashboard | Sales KPI Dashboards | A ... - Conceptdraw.com
- Sales KPI Dashboards | KPIs and Metrics | A KPI Dashboard |
- Design elements - Meter indicators 2 | Design elements - Status ...
- Sales Dashboard | PM Dashboards | A KPI Dashboard |
- Sales Dashboard | Sales Dashboard Template | Sales Dashboard ...
- Design elements - Meter indicators 2 | Constant improvement of key ...
- A KPI Dashboard | A KPI Dashboard Provides the Answers Your ...
- KPIs and Metrics | Design elements - Meter indicators 2 | Enterprise ...
- Sales KPI Dashboards - Conceptdraw.com
- Data Flow Diagrams
- Cafe performance metrics vs. air temperature - Visual dashboard ...
- Design elements - Status indicators | Design elements - Meter ...
- Design elements - Composition charts and indicators | Constant ...
- Sales Dashboard | PM Dashboards | Meter Dashboard |
- Visualize Sales Data Using Sample Data | Sales Dashboard ...
- Business Diagram Software | Export from ConceptDraw PRO ...
- ERD | Entity Relationship Diagrams, ERD Software for Mac and Win
- Flowchart | Basic Flowchart Symbols and Meaning
- Flowchart | Flowchart Design - Symbols, Shapes, Stencils and Icons
- Flowchart | Flow Chart Symbols
- Electrical | Electrical Drawing - Wiring and Circuits Schematics
- Flowchart | Common Flowchart Symbols
- Flowchart | Common Flowchart Symbols