Performance Indicators

The vector stencils library "Sales KPIs and Metrics" contains 15 chart templates and graphic indicators of sales key performance indicators (KPIs) and metrics for drawing sales dashboards: line charts "Cost per order" and "Clicks from Sales Follow-Up Emails", column charts "Social Media Usage" and "Usage Rate of Marketing Collateral", horizontal bar charts "Rate of Follow Up Contact", "Cost per customer" and "Lead Response Time", pie charts "Product mix", "Product Performance" and "Rate of Contact", gauge (speedometer) indicators "Sales Growth" and "Actual vs Plan", bullet indicator "Sales Target", diamond alarm indicators "Average Purchase Value", "Quote to Close Ratio", "Opportunity-to-Win Ratio" and "Sales Ratio".
The dashboard charts and indicators example "Design elements - Sales KPIs and metrics" for the ConceptDraw PRO diagramming and vector drawing software is included in the Sales Dashboard solution from the Marketing area of ConceptDraw Solution Park.
www.conceptdraw.com/ solution-park/ marketing-sales-dashboard
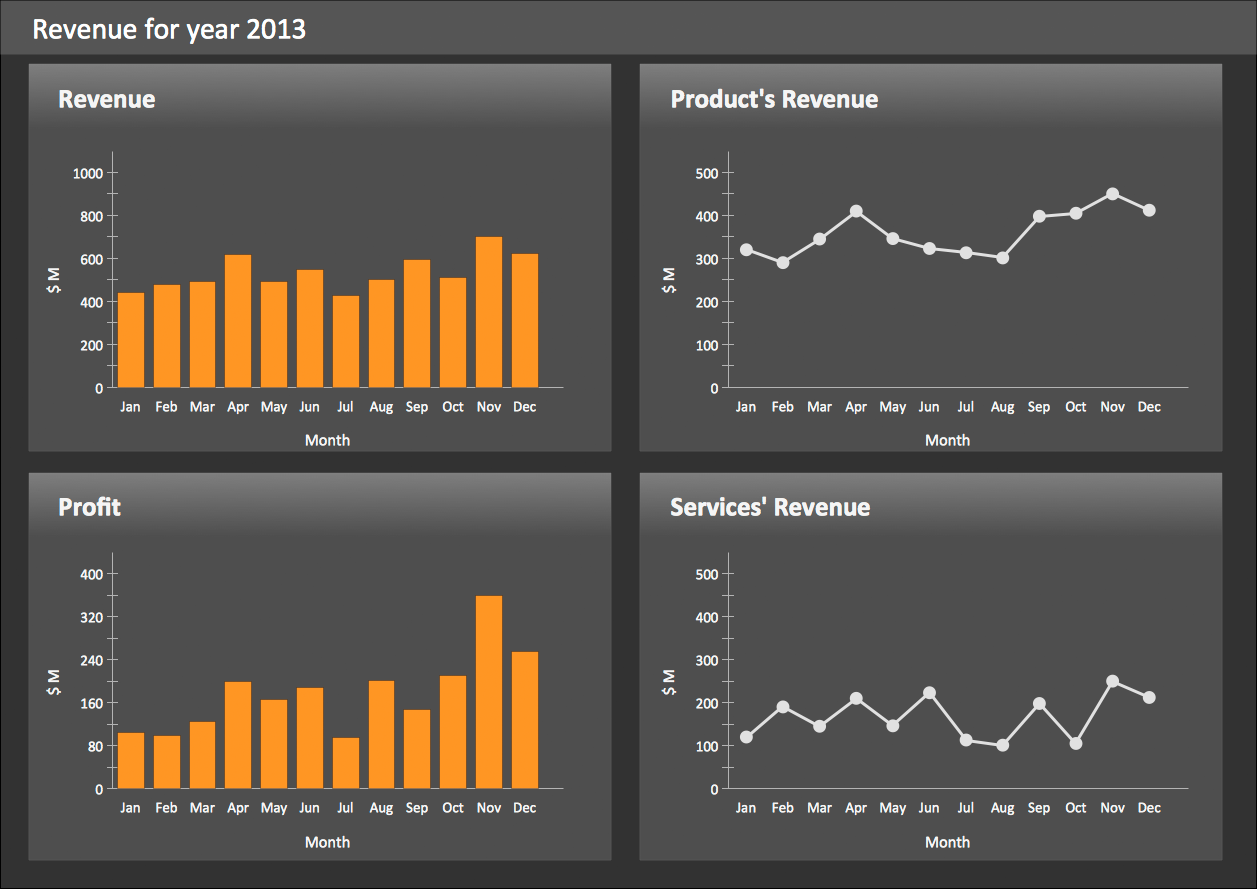
Sales dashboard charts and graphic indicators

KPI Dashboard

The Facts and KPIs

 Logistic Dashboard
The powerful tools of Logistic Dashboard solution and specially developed live graphic objects of logistic icons, logistic navigation elements, logistic indicators, logistic charts and logistic maps effectively assist in designing Logistic dashboards, Logistic maps, Logistic charts, diagrams and infographics. The included set of prebuilt samples and quick-start templates, demonstrates the power of ConceptDraw DIAGRAM software in logistics management, its assisting abilities in development, realization and analyzing the logistic processes, as well as in perfection the methods of logistics management.
What is a KPI?
ConceptDraw DIAGRAM diagramming and vector drawing software enhanced with Sales Dashboard solution from the Marketing area of ConceptDraw Solution Park allows effectively develop, analyze and improve your business thanks to the excellent possibility of monitoring all KPIs on one screen in a real time.
Constant improvement of key performance indicators
"Dashboards give signs about a business letting the user know something is wrong or something is right. ...
Balanced Scoreboards and Dashboards have been linked together as if they were interchangeable. However, although both visually display critical information, the difference is in the format: Scoreboards can open the quality of an operation while dashboards provide calculated direction. A balanced scoreboard has what they called a “prescriptive” format. It should always contain these components (Active Strategy) ...
(1) Perspectives – groupings of high level strategic areas.
(2) Objectives – verb-noun phrases pulled from a strategy plan.
(3) Measures – also called Metric or Key Performance Indicators (KPIs).
(4) Spotlight Indicators – red, yellow, or green symbols that provide an at-a-glance view of a measure’s performance.
Each of these sections ensures that a Balanced Scorecard is essentially connected to the businesses critical strategic needs.
The design of a dashboard is more loosely defined. Dashboards are usually a series of graphics, charts, gauges and other visual indicators that can be monitored and interpreted. Even when there is a strategic link, on a dashboard, it may not be noticed as such since objectives are not normally present on dashboards. However, dashboards can be customized to link their graphs and charts to strategic objectives." [Dashboard (business). Wikipedia]
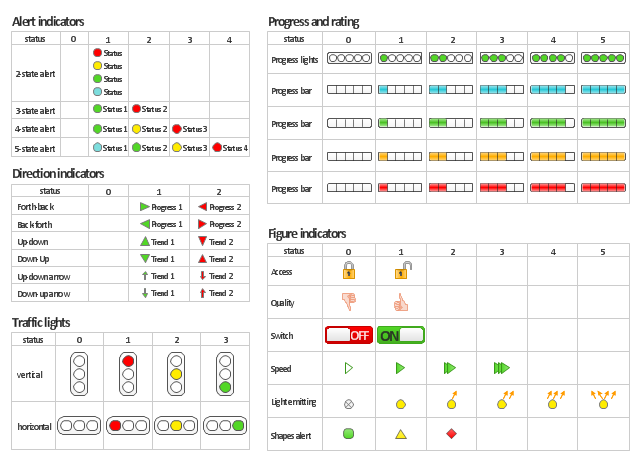
The vector stencils library "Status indicators" contains 41 visual status indicators for creating the business performance dashboards using the ConceptDraw PRO diagramming and vector drawing software.
Each status indicator can visualize one of 2-6 information states and have a caption.
Status indicators allow you quickly estimate, where your immediate decision and action is critical.
The example "Design elements - Status indicators" is included in the Status Dashboard solution from the area "What is a Dashboard" of ConceptDraw Solution Park.
Balanced Scoreboards and Dashboards have been linked together as if they were interchangeable. However, although both visually display critical information, the difference is in the format: Scoreboards can open the quality of an operation while dashboards provide calculated direction. A balanced scoreboard has what they called a “prescriptive” format. It should always contain these components (Active Strategy) ...
(1) Perspectives – groupings of high level strategic areas.
(2) Objectives – verb-noun phrases pulled from a strategy plan.
(3) Measures – also called Metric or Key Performance Indicators (KPIs).
(4) Spotlight Indicators – red, yellow, or green symbols that provide an at-a-glance view of a measure’s performance.
Each of these sections ensures that a Balanced Scorecard is essentially connected to the businesses critical strategic needs.
The design of a dashboard is more loosely defined. Dashboards are usually a series of graphics, charts, gauges and other visual indicators that can be monitored and interpreted. Even when there is a strategic link, on a dashboard, it may not be noticed as such since objectives are not normally present on dashboards. However, dashboards can be customized to link their graphs and charts to strategic objectives." [Dashboard (business). Wikipedia]
The vector stencils library "Status indicators" contains 41 visual status indicators for creating the business performance dashboards using the ConceptDraw PRO diagramming and vector drawing software.
Each status indicator can visualize one of 2-6 information states and have a caption.
Status indicators allow you quickly estimate, where your immediate decision and action is critical.
The example "Design elements - Status indicators" is included in the Status Dashboard solution from the area "What is a Dashboard" of ConceptDraw Solution Park.
Visual status indicators
 HR Dashboard
The HR Dashboard solution extends ConceptDraw DIAGRAM functionality with powerful drawing tools and great collection of comprehensive vector design elements, icons, pictograms and objects, navigation elements, live objects of HR charts, HR indicators, and thematic maps. The range of HR Dashboards applications is extensive, among them the human resource management, recruitment, hiring process, human resource development. ConceptDraw DIAGRAM software is perfect for creation HR Dashboard with any goal you need. It gives you all opportunities for designing not only informative, but also professional looking and attractive HR Dashboards of any style and degree of detalization, that are perfect for using in presentations, reports and other thematic documents.
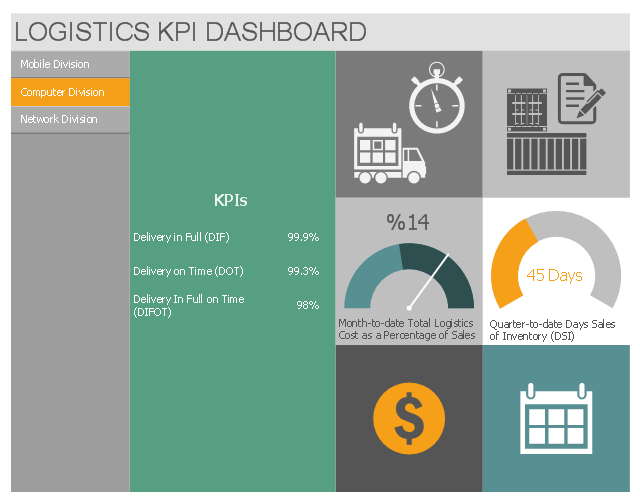
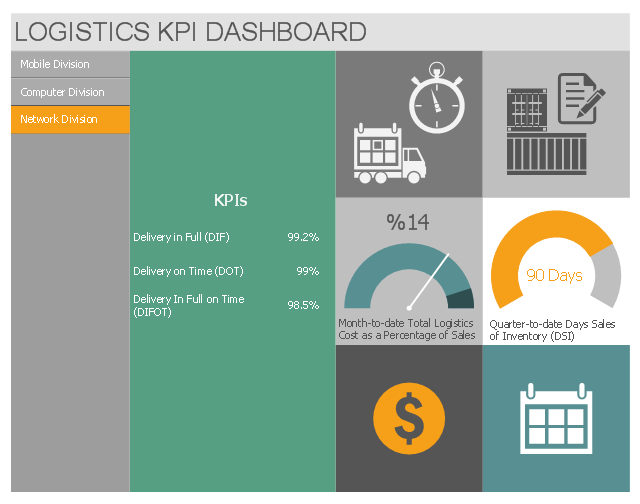
This multipage business dashboard example shows navigation vertical menu and graphic indicators of logistic key performance indicators (KPIs) and business metrics.
"A performance indicator or key performance indicator (KPI) is a type of performance measurement. KPIs evaluate the success of an organization or of a particular activity in which it engages. Often success is simply the repeated, periodic achievement of some levels of operational goal..., and sometimes success is defined in terms of making progress toward strategic goals. Accordingly, choosing the right KPIs relies upon a good understanding of what is important to the organization." [Performance indicator. Wikipedia]
The performance dashboard example "Logistics KPI Dashboard" was designed using ConceptDraw PRO software extended with Logistic Dashboard solution from Business Processes area of ConceptDraw Solution Park.
Mobile Division
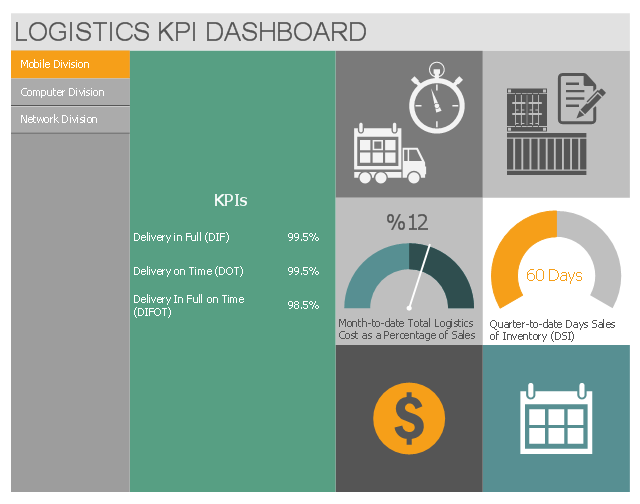
Computer Division
Network Division
- Sample Kpi Graphic Designer
- Design elements - Sales KPIs and metrics | Graphic Designer Kpi ...
- Graphic Designer Kpi Sample
- Design elements - Sales KPIs and metrics
- KPIs and Metrics | Design elements - Sales KPIs and metrics | TQM ...
- Status Dashboard | Design elements - Status indicators | Status ...
- Dashboard Design Templates Columns And Pie
- Sample Of Payroll Kpi
- Performance Indicators | KPI Dashboard | Constant improvement of ...
- Performance Indicators | Constant improvement of key performance ...
- ERD | Entity Relationship Diagrams, ERD Software for Mac and Win
- Flowchart | Basic Flowchart Symbols and Meaning
- Flowchart | Flowchart Design - Symbols, Shapes, Stencils and Icons
- Flowchart | Flow Chart Symbols
- Electrical | Electrical Drawing - Wiring and Circuits Schematics
- Flowchart | Common Flowchart Symbols
- Flowchart | Common Flowchart Symbols