"Point of sale (also called POS or checkout) is the place where a retail transaction is completed. It is the point at which a customer makes a payment to the merchant in exchange for goods or services. At the point of sale the retailer would calculate the amount owed by the customer and provide options for the customer to make payment. The merchant will also normally issue a receipt for the transaction. ...
The modern point of sale is often referred to as the point of service because it is not just a point of sale but also a point of return or customer order. Additionally it includes advanced features to cater to different functionality, such as inventory management, CRM, financials, warehousing, etc., all built into the POS software. Prior to the modern POS, all of these functions were done independently and required the manual re-keying of information, which can lead to entry errors." [Point of sale. Wikipedia]
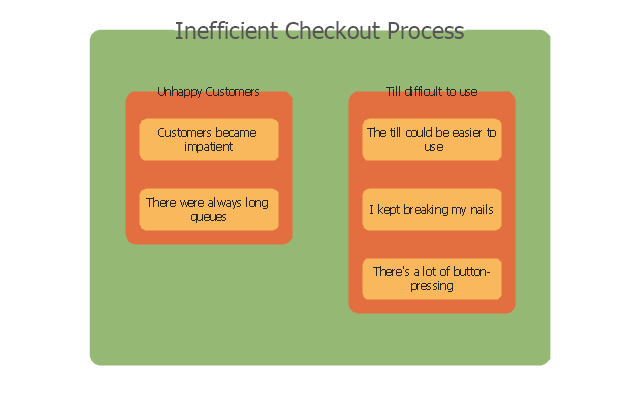
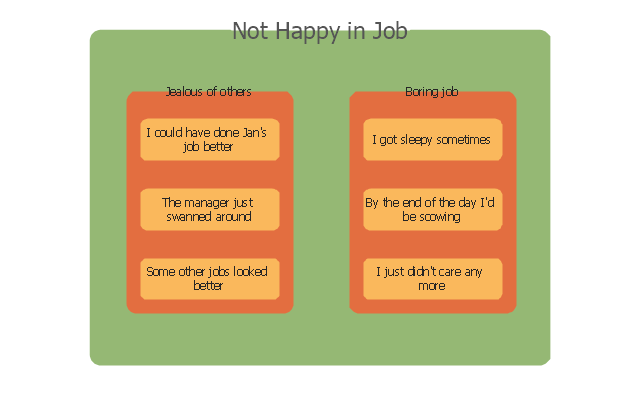
The affinity diagram example "Checkout operators leaving job" was created using the ConceptDraw PRO diagramming and vector drawing software extended with the solution "Seven Management and Planning Tools" from the Management area of ConceptDraw Solution Park.
The modern point of sale is often referred to as the point of service because it is not just a point of sale but also a point of return or customer order. Additionally it includes advanced features to cater to different functionality, such as inventory management, CRM, financials, warehousing, etc., all built into the POS software. Prior to the modern POS, all of these functions were done independently and required the manual re-keying of information, which can lead to entry errors." [Point of sale. Wikipedia]
The affinity diagram example "Checkout operators leaving job" was created using the ConceptDraw PRO diagramming and vector drawing software extended with the solution "Seven Management and Planning Tools" from the Management area of ConceptDraw Solution Park.
Affinity diagram
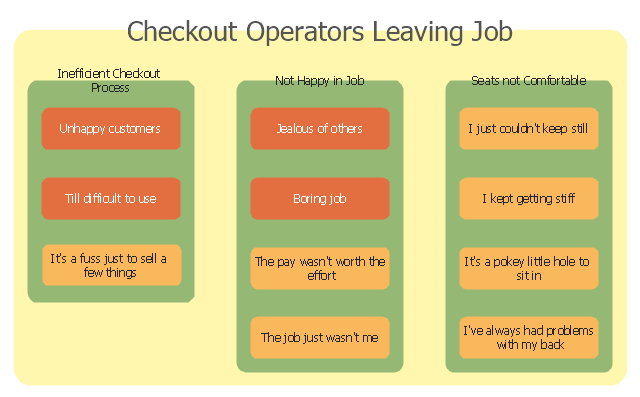
Inefficient checkout process
Not happy in job
Affinity Diagram
This diagram is designed to prepare the data for further analysis of the cause-effect relationships. A typical size for an Affinity Diagram is approximately 40-50 topics in a chart.
Organizational Charts with ConceptDraw DIAGRAM

Affinity Diagram

UML Use Case Diagram Example. Social Networking Sites Project

This sample shows the Facebook Socio-health system and is used at the projection and creating of the social networking sites.
How to Draw Business Process Diagrams with RapidDraw Interface

Biology Symbols
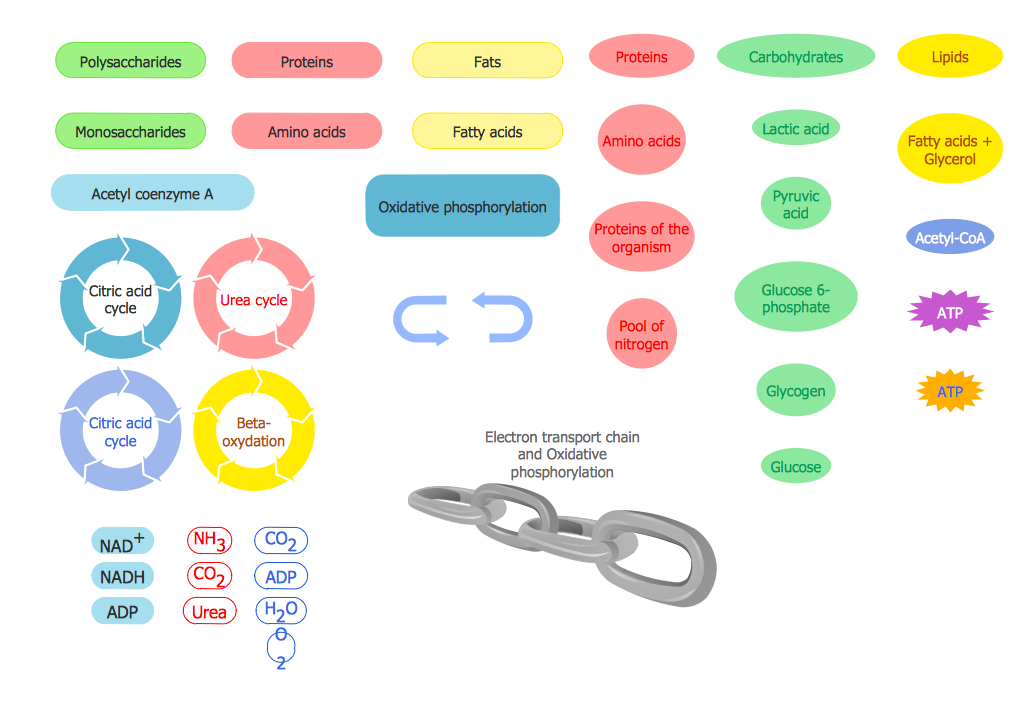
Biology solution provides 3 libraries with large quantity of vector biology symbols: Biochemistry of Metabolism Library, Carbohydrate Metabolism Library, Citric Acid Cycle (TCA Cycle) Library.
 Seven Management and Planning Tools
Seven Management and Planning Tools solution extends ConceptDraw DIAGRAM and ConceptDraw MINDMAP with features, templates, samples and libraries of vector stencils for drawing management mind maps and diagrams.
Flowchart Marketing Process. Flowchart Examples

Using the ready-to-use predesigned objects, samples and templates from the Flowcharts Solution for ConceptDraw DIAGRAM you can create your own professional looking Flowchart Diagrams quick and easy.
Learn how to create a current state value stream map

Scientific Symbols Chart

Mathematics Solution from the Science and Education area of ConceptDraw Solution Park includes a few shape libraries of plane, solid geometric figures, trigonometrical functions and greek letters to help you create different professional looking mathematic illustrations for science and education.
Venn Diagram Examples for Problem Solving. Venn Diagram as a Truth Table

 Azure Architecture
Azure Architecture solution bundles into one handy tool everything you need to create effective Azure Architecture diagrams. It adds the extra value to versatile ConceptDraw DIAGRAM software and extends the users capabilities with comprehensive collection of Microsoft Azure themed graphics, logos, preset templates, wide array of predesigned vector symbols that covers the subjects such as Azure management, Azure storage, and Azure services, amongst others, and allow you to illustrate Azure Architecture diagrams at any degree of complexity, to present visually your Azure cloud system architecture with professional style, to design Azure cloud topology, to document Windows Azure Architecture and Azure Cloud System Architecture, to visualize the great abilities and work of Microsoft Azure Cloud System and Azure services.
- Use the Best FlowChart Tool for the Job | Affinity diagram - Checkout ...
- Affinity diagram - Checkout operators leaving job | Affinity diagram ...
- Affinity diagram - Checkout operators leaving job | Affinity Diagram ...
- Affinity diagram - Checkout operators leaving job | Flow chart ...
- Affinity diagram - Checkout operators leaving job | Use the Best ...
- Affinity diagram - Checkout operators leaving job
- Affinity Diagram | Affinity diagram - Checkout operators leaving job ...
- Seven Management and Planning Tools | Affinity diagram ...
- Affinity diagram - Implementing continuous process improvement ...
- How To Create an Affinity Diagram Using ConceptDraw Office ...
- Affinity Diagram | Affinity diagram - Implementing continuous ...
- Affinity Diagram | Affinity Diagram Software | How To Create an ...
- Use the Best FlowChart Tool for the Job | Business process diagram ...
- Process Flowchart | Workflow For Online Job Portal System Flow Chart
- Affinity Diagram | How to Draw Business Process Diagrams with ...
- Affinity Diagram | Affinity diagram - Implementing continuous ...
- Activity Diagram For Job Portal
- How To Create an Affinity Diagram Using ConceptDraw Office ...
- Job Logic Diagram
- Hiring process workflow | Double-headed Cross Functional ...
- ERD | Entity Relationship Diagrams, ERD Software for Mac and Win
- Flowchart | Basic Flowchart Symbols and Meaning
- Flowchart | Flowchart Design - Symbols, Shapes, Stencils and Icons
- Flowchart | Flow Chart Symbols
- Electrical | Electrical Drawing - Wiring and Circuits Schematics
- Flowchart | Common Flowchart Symbols
- Flowchart | Common Flowchart Symbols